plotprofile
Plot expected marginal means with optional grouping
Description
plotprofile(
specifies additional options by one or more name-value arguments. For example, you
can specify the factors to group by or change the line colors.rm,X,Name,Value)
H = plotprofile(___)H to the plotted lines.
Examples
Load the sample data.
load fisheririsThe column vector species consists of iris flowers of three different species: setosa, versicolor, and virginica. The double matrix meas consists of four types of measurements on the flowers: the length and width of sepals and petals in centimeters, respectively.
Store the data in a table array.
t = table(species,meas(:,1),meas(:,2),meas(:,3),meas(:,4),...
VariableNames=["species","meas1","meas2","meas3","meas4"]);
Meas = table([1 2 3 4]',VariableNames="Measurements");
Fit a repeated measures model, where the measurements are the responses and the species is the predictor variable.
rm = fitrm(t,"meas1-meas4~species",WithinDesign=Meas);Perform data grouped by the factor species.
plotprofile(rm,"species")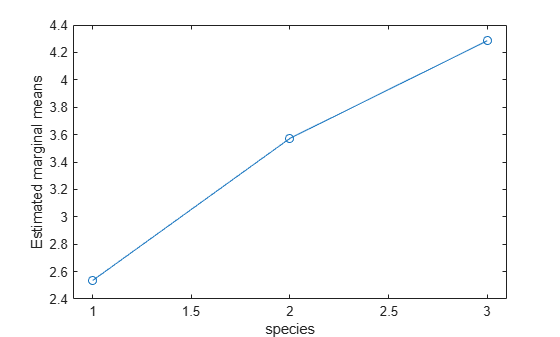
The estimated marginal means seem to differ with group. You can compute the standard error and the 95% confidence intervals for the marginal means using the margmean method.
Load the sample data.
load repeatedmeasThe table between includes the between-subject variables age, IQ, group, gender, and eight repeated measures y1 through y8 as responses. The table within includes the within-subject variables w1 and w2. This is simulated data.
Fit a repeated measures model, where the repeated measures y1 through y8 are the responses, and age, IQ, group, gender, and the group-gender interaction are the predictor variables. Also specify the within-subject design matrix.
rm = fitrm(between,'y1-y8 ~ Group*Gender + Age + IQ','WithinDesign',within);
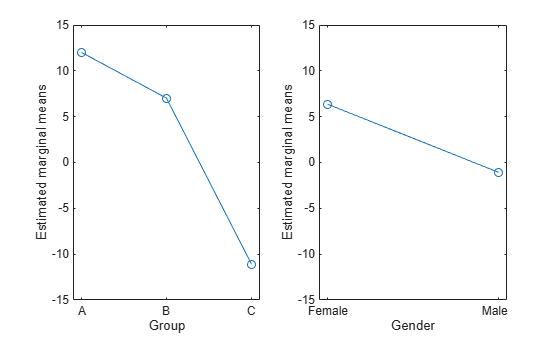
Plot the estimated marginal means based on the factors Group and Gender.
ax1 = subplot(1,2,1);
plotprofile(rm,'Group')
ax2 = subplot(1,2,2);
plotprofile(rm,'Gender')
linkaxes([ax1 ax2],'y')
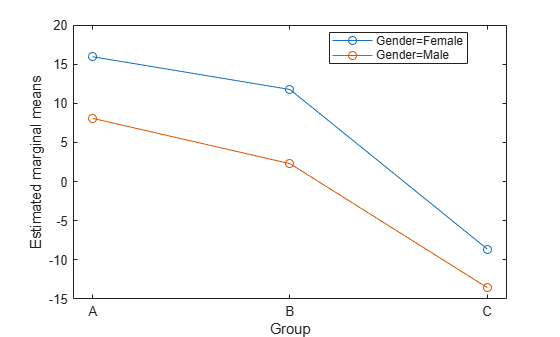
Plot the estimated marginal means based on the factor Group and grouped by Gender.
figure()
plotprofile(rm,'Group','Group','Gender')