ecdfhist
Histogram based on empirical cumulative distribution function
Syntax
Description
[ returns
the heights, n,c] =
ecdfhist(f,x)n, of histogram bars for 10 equally
spaced bins and the position of the bin centers, c.
ecdfhist computes the bar heights from the
increases in the empirical cumulative distribution function, f,
at evaluation points, x. It normalizes the bar
heights so that the area of the histogram is equal to 1. In contrast, histogram produces bars with heights
representing bin counts.
ecdfhist(___) plots the histogram bars using any of the input
argument combinations in the previous syntaxes.
Examples
Compute the histogram bar heights based on the empirical cumulative distribution function.
Generate failure times from a Birnbaum-Saunders distribution.
rng('default') % for reproducibility failuretime = random('birnbaumsaunders',0.3,1,100,1);
Assuming that the end of the study is at time 0.9, mark the generated failure times that are larger than 0.9 as censored data and store that information in a vector.
T = 0.9; cens = (failuretime>T);
Compute the empirical cumulative distribution function for the data.
[f,x] = ecdf(failuretime,'censoring',cens);Now, find the bar heights of the histogram using the cumulative distribution function estimate.
[n,c] = ecdfhist(f,x); [n' c']
ans = 10×2
2.3529 0.0715
1.7647 0.1565
1.4117 0.2415
1.5294 0.3265
1.0588 0.4115
0.4706 0.4965
0.4706 0.5815
0.9412 0.6665
0.2353 0.7515
0.2353 0.8365
Compute the bar heights for six bins using the empirical cumulative distribution function and also return the bin centers.
Generate failure times from a Birnbaum-Saunders distribution.
rng('default') % for reproducibility
failuretime = random('birnbaumsaunders',0.3,1,100,1);
Assuming that the end of the study is at time 0.9, mark the generated failure times that are larger than 0.9 as censored data and store that information in a vector.
T = 0.9;
cens = (failuretime>T);
First, compute the empirical cumulative distribution function for the data.
[f,x] = ecdf(failuretime,'censoring',cens);Now, estimate the histogram with six bins using the cumulative distribution function estimate.
[n,c] = ecdfhist(f,x,6); [n' c']
ans = 6×2
1.9764 0.0998
1.7647 0.2415
1.1294 0.3831
0.4235 0.5248
0.7764 0.6665
0.2118 0.8081
Draw the histogram of the empirical cumulative distribution histogram for specified bin centers.
Generate failure times from a Birnbaum-Saunders distribution.
rng default; % For reproducibility failuretime = random('birnbaumsaunders',0.3,1,100,1);
Assuming that the end of the study is at time 0.9, mark the generated failure times that are larger than 0.9 as censored data and store that information in a vector.
T = 0.9;
cens = (failuretime>T);
Define bin centers.
centers = 0.1:0.1:1;
Compute the empirical cumulative distribution function for the data and draw the histogram for specified bin centers.
[f,x] = ecdf(failuretime,'censoring',cens);
ecdfhist(f,x,centers)
axis([0 1 0 2.5])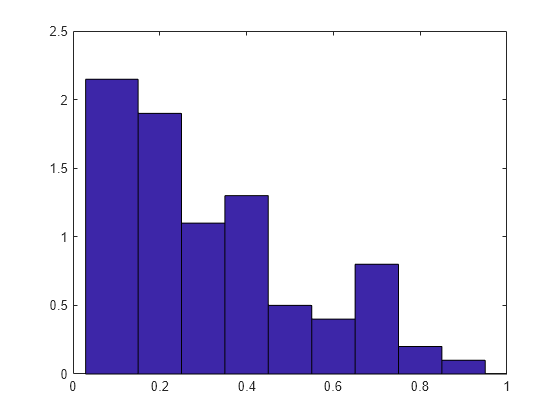
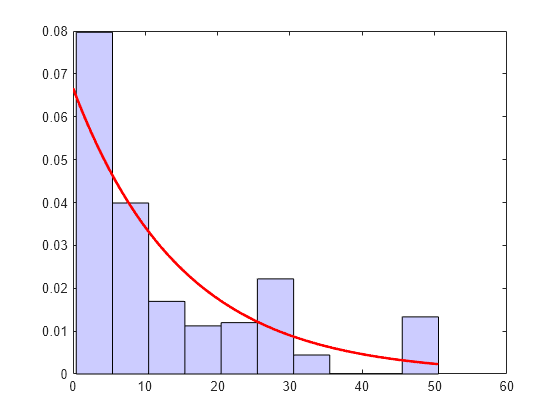
Generate right-censored survival data and compare the histogram from cumulative distribution function with the known probability distribution function.
Generate failure times from an exponential distribution with mean failure time of 15.
rng default; % For reproducibility
y = exprnd(15,75,1);
Generate drop-out times from an exponential distribution with mean failure time of 30.
d = exprnd(30,75,1);
Record the minimum of these times as the observed failure times.
t = min(y,d);
Generate censoring by finding the generated failure times that are greater than the drop-out times.
censored = (y>d);
Calculate the empirical cdf and plot a histogram using the empirical cumulative distribution function.
[f,x] = ecdf(t,'censoring',censored);
ecdfhist(f,x)
h = findobj(gca,'Type','patch');
h.FaceColor = [.8 .8 1];
hold on

Superimpose a plot of the known population pdf.
xx = 0:.1:max(t);
yy = exp(-xx/15)/15;
plot(xx,yy,'r-','LineWidth',2)
hold off
Input Arguments
Output Arguments
Alternative Functionality
You can create an EmpiricalDistribution object by fitting a distribution to data using the
fitdist function. After fitting, you can
use the plot object
function to plot a histogram of the data or the cdf. Other
EmpiricalDistribution object functions allow you to calculate the
inverse cdf, evaluate the probability density function (pdf), and generate random
numbers from the distribution.
Version History
Introduced before R2006a