plotHistogram
Syntax
Description
plotHistogram( plots a
histogram of the baseline and target data for the variable with the lowest
p-value computed by the DDiagnostics)detectdrift
function.
If you set the value of EstimatePValues to
false in the call to detectdrift, then
plotHistogram displays NaN for the
p-value and the drift status.
plotHistogram(
plots the histogram of the baseline and target data for the variable specified by
DDiagnostics,Variable=variable)variable.
H = plotHistogram(___)Histogram objects in
H. Use H to inspect and modify the properties of
the histogram. For more information, see Histogram Properties.
Examples
Generate baseline and target data with three variables, where the distribution parameters of the second and third variables change for the target data.
rng('default') % For reproducibility
baseline = [normrnd(0,1,100,1),wblrnd(1.1,1,100,1),betarnd(1,2,100,1)];
target = [normrnd(0,1,100,1),wblrnd(1.2,2,100,1),betarnd(1.7,2.8,100,1)];
Perform permutation testing for all variables to check for any drift between the baseline and target data.
DDiagnostics = detectdrift(baseline,target)
DDiagnostics =
  DriftDiagnostics

              VariableNames: ["x1"    "x2"    "x3"]
       CategoricalVariables: []
                DriftStatus: ["Stable"    "Drift"    "Warning"]
                    PValues: [0.3850 0.0050 0.0910]
        ConfidenceIntervals: [2×3 double]
    MultipleTestDriftStatus: "Drift"
             DriftThreshold: 0.0500
           WarningThreshold: 0.1000


  Properties, Methods
Plot the histogram for the default variable.
plotHistogram(DDiagnostics)
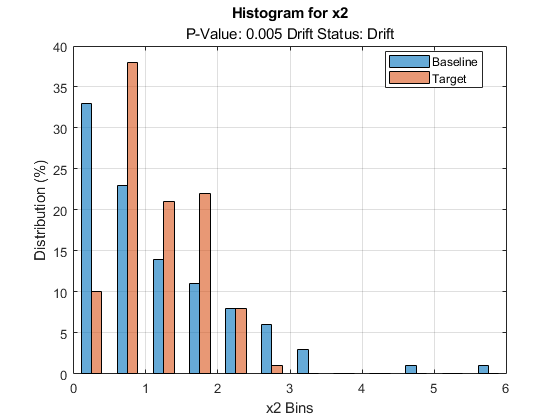
By default, plotHistogram plots a histogram of the baseline and target data for the variable with the lowest p-value. The function also displays the p-value and the drift status for the variable.
Generate baseline and target data with three variables, where the distribution parameters of the second and third variables change for the target data.
rng('default') % For reproducibility
baseline = [normrnd(0,1,100,1),wblrnd(1.1,1,100,1),betarnd(1,2,100,1)];
target = [normrnd(0,1,100,1),wblrnd(1.2,2,100,1),betarnd(1.7,2.8,100,1)];
Perform permutation testing for all variables to check for any drift between the baseline and target data. Use the Energy statistic as the metric.
DDiagnostics = detectdrift(baseline,target,ContinuousMetric="energy")DDiagnostics =
DriftDiagnostics
VariableNames: ["x1" "x2" "x3"]
CategoricalVariables: []
DriftStatus: ["Stable" "Drift" "Warning"]
PValues: [0.3790 0.0110 0.0820]
ConfidenceIntervals: [2×3 double]
MultipleTestDriftStatus: "Drift"
DriftThreshold: 0.0500
WarningThreshold: 0.1000
Properties, Methods
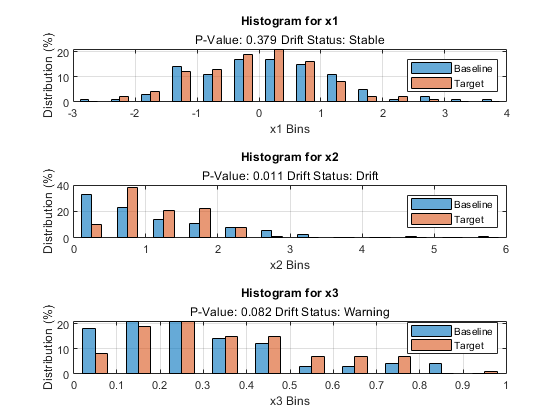
Plot the histograms for all three variables in a tiled layout.
tiledlayout(3,1);
ax1 = nexttile;
plotHistogram(DDiagnostics,ax1,Variable="x1")
ax2 = nexttile;
plotHistogram(DDiagnostics,ax2,Variable="x2")
ax3 = nexttile;
plotHistogram(DDiagnostics,ax3,Variable="x3")
Generate baseline and target data with three variables, where the distribution parameters of the second and third variables change for the target data.
rng('default') % For reproducibility
baseline = [normrnd(0,1,100,1),wblrnd(1.1,1,100,1),betarnd(1,2,100,1)];
target = [normrnd(0,1,100,1),wblrnd(1.2,2,100,1),betarnd(1.7,2.8,100,1)];
Perform permutation testing for all variables to check for any drift between the baseline and target data.
DDiagnostics = detectdrift(baseline,target)
DDiagnostics =
  DriftDiagnostics

              VariableNames: ["x1"    "x2"    "x3"]
       CategoricalVariables: []
                DriftStatus: ["Stable"    "Drift"    "Warning"]
                    PValues: [0.3850 0.0050 0.0910]
        ConfidenceIntervals: [2×3 double]
    MultipleTestDriftStatus: "Drift"
             DriftThreshold: 0.0500
           WarningThreshold: 0.1000


  Properties, Methods
Plot the histogram for the first variable and return the Histogram object.
H = plotHistogram(DDiagnostics,Variable=1)
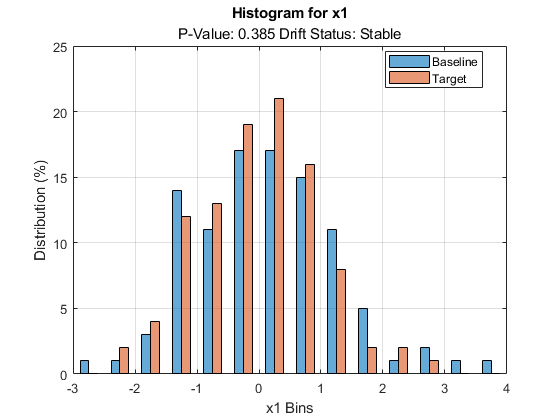
H =
  2×1 Bar array:

  Bar    (Baseline)
  Bar    (Target)
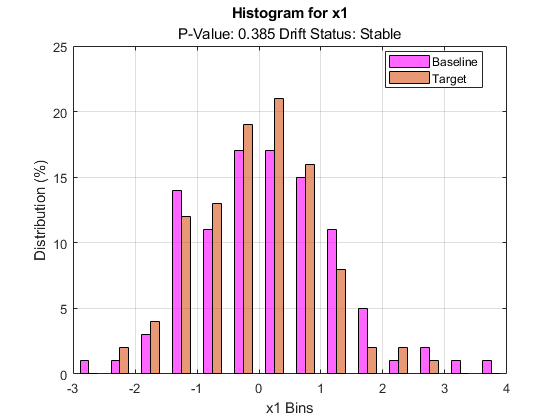
Change the color of the histogram bars for the baseline data.
H(1).FaceColor = [1 0 1];
Input Arguments
Algorithms
For categorical data,
detectdriftadds a 0.5 correction factor to the histogram bin counts for each bin to handle empty bins (categories). This is equivalent to the assumption that the parameter p, probability that value of the variable would be in that category, has the prior distribution Beta(0.5,0.5), (Jeffreys prior assumption for the distribution parameter).plotHistogramtreats a variable as ordinal for visualization purposes in these cases:The variable is ordinal in either the baseline data or the target data, and the categories from both the baseline data and the target data are the same.
The variable is ordinal in either the baseline data or the target data, and the categories of the other data set are a subset of the ordinal data.
The variable is ordinal in both the baseline data and the target data, and categories from either data set are a subset of the other.
If a variable is ordinal,
plotHistogrampreserves the order of the bin names.
Version History
Introduced in R2022a
See Also
detectdrift | DriftDiagnostics | plotDriftStatus | plotEmpiricalCDF | plotPermutationResults | ecdf | summary | histcounts