Plot Posterior Classification Probabilities
This example shows how to visualize posterior classification probabilities predicted by a naive Bayes classification model.
Load Fisher's iris data set.
load fisheriris
X = meas(:,1:2);
Y = species;
labels = unique(Y);
X is a numeric matrix that contains two sepal measurements for 150 irises. Y is a cell array of character vectors that contains the corresponding iris species.
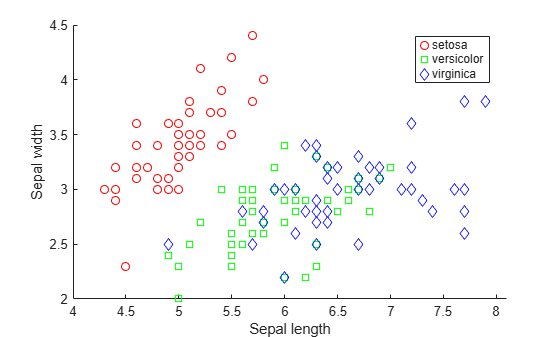
Visualize the data using a scatter plot. Group the variables by iris species.
figure;
gscatter(X(:,1), X(:,2), species,'rgb','osd');
xlabel('Sepal length');
ylabel('Sepal width');
Train a naive Bayes classifier.
mdl = fitcnb(X,Y);
mdl is a trained ClassificationNaiveBayes classifier.
Create a grid of points spanning the entire space within some bounds of the data. The data in X(:,1) ranges between 4.3 and 7.9. The data in X(:,2) ranges between 2 and 4.4.
[xx1, xx2] = meshgrid(4:.01:8,2:.01:4.5);
XGrid = [xx1(:) xx2(:)];
Predict the iris species and posterior class probabilities of each observation in XGrid using mdl.
[predictedspecies,Posterior,~] = predict(mdl,XGrid);
Plot the posterior probability distribution for each species.
sz = size(xx1);
s = max(Posterior,[],2);

figure
hold on
surf(xx1,xx2,reshape(Posterior(:,1),sz),'EdgeColor','none')
surf(xx1,xx2,reshape(Posterior(:,2),sz),'EdgeColor','none')
surf(xx1,xx2,reshape(Posterior(:,3),sz),'EdgeColor','none')
xlabel('Sepal length');
ylabel('Sepal width');
colorbar
view(2)
hold off
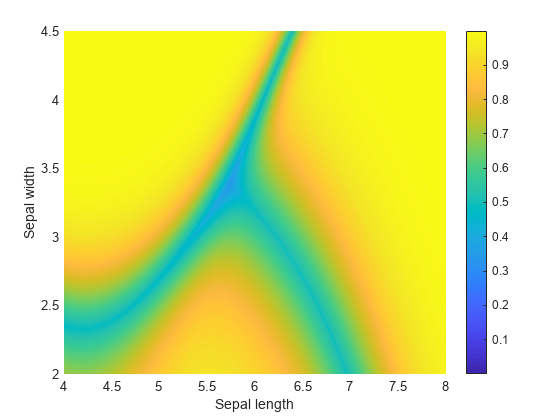
The closer an observation gets to the decision surface, the less probable it is that the data belongs to a certain species.
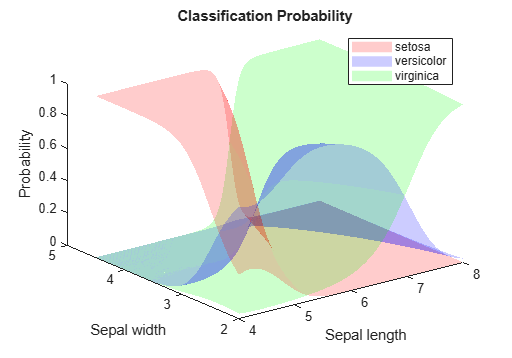
Plot the classification probability distributions individually.
figure('Units','Normalized','Position',[0.25,0.55,0.4,0.35]);
hold on
surf(xx1,xx2,reshape(Posterior(:,1),sz),'FaceColor','red','EdgeColor','none')
surf(xx1,xx2,reshape(Posterior(:,2),sz),'FaceColor','blue','EdgeColor','none')
surf(xx1,xx2,reshape(Posterior(:,3),sz),'FaceColor','green','EdgeColor','none')
xlabel('Sepal length');
ylabel('Sepal width');
zlabel('Probability');
legend(labels)
title('Classification Probability')
alpha(0.2)
view(3)
hold off