Connect Dashboard Blocks to Stateflow
Dashboard blocks help you to control and visualize your Stateflow® chart during simulation and while your simulation is paused. Dashboard blocks can be used to bind to Stateflow in order to:
Monitor self, child, and leaf activity of a state.
Monitor local and output data within states, transitions, or graphical functions.
To connect a dashboard block to data or to a Stateflow state, point to the dashboard block. Above the block, a connect button appears.
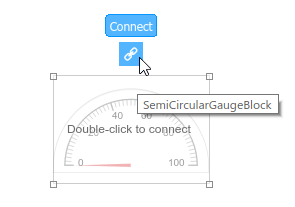
Click the Connect button, and navigate to the Stateflow object you want to connect to.
Note
The Double-click to connect feature is not supported in Stateflow.
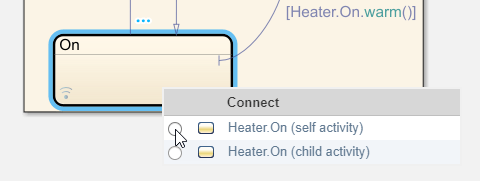
Click a state or transition, and choose which activity or data you want to connect.
Dashboard block connection is not supported for MATLAB® Functions, Simulink® Functions, or truth tables. For more information on dashboard blocks, see Control Simulations with Interactive Dashboards (Simulink).
Monitor a Boiler with Dashboard Blocks
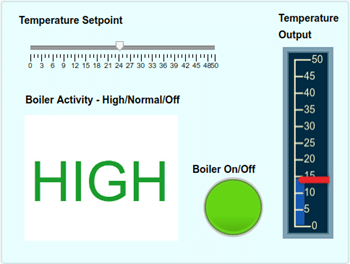
This example shows how to use dashboard blocks to control the temperature setpoint for a boiler and visualize when the boiler is on or off and what mode it is operating in.
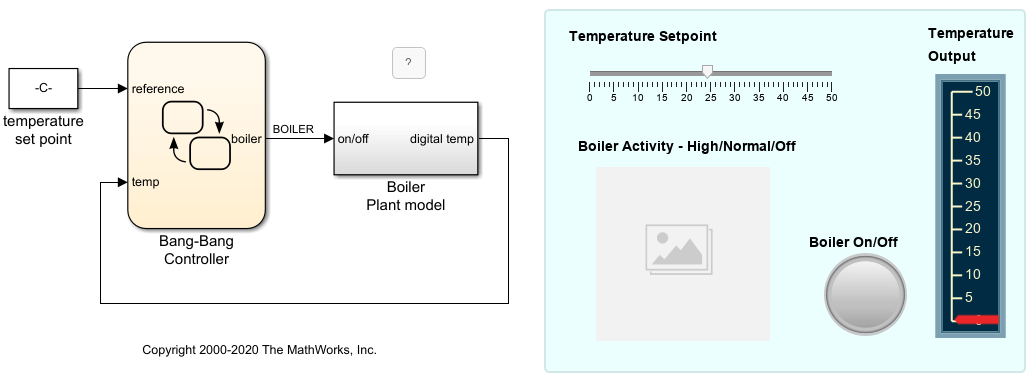
The example also uses dashboard blocks to visualize the temperature output by the boiler, which should match the temperature setpoint.
When you simulate the model, the LED light flashes to show whether the boiler is on or off. A red light indicates that the boiler is off.
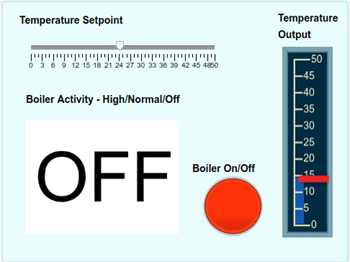
A green light indicates that the boiler is on. The Boiler Activity - Hight/Normal/Off block shows you if the boiler is operating in high or normal mode.