Map Data Using Root Inport Mapper Tool
Use the Root Inport Mapper tool to import, visualize, and map signal and bus data to root-level inports.
Root-level inport mapping meets most modeling requirements and maintains model flexibility. For supported signal data, see Create Signal Data for Root Inport Mapping. Root import level mapping lets you:
Test your model with signals from the workspace and use your model as a referenced model in a larger context without any modification. Test signals in your model without disconnecting the inports and connecting sources to them.
Use the Root Inport Mapper tool to update the Input parameter based on the signal data that you import and map to root-level inports.
Visually inspect signal data without loading all the signal data into MATLAB® memory.
To use the Root Inport Mapper tool:
Create signal data in the MATLAB workspace.
For a Simulink® model, import the data from the workspace. You can visualize the data you import.
Map the data to root-level inports.
Simulate the model.
Save the Root Inport Mapper scenario.
The Model
This example shows how you can use the Root Inport Mapper tool to test the model with data. This approach can be useful for performing standalone testing of a model that another model references.
The example uses a model with three root-level Inport blocks. Two of the Inport blocks output scalar signals and the other Inport block outputs bus data.
model='ex_root_inport_mapping_example';
open_system(model)
Create Signal Data
You can define the signal data as MATLAB
timeseries objects.
Define the time values for the signal data.
sampleTime = 0.01;
endTime = 10;
numberOfSamples = endTime * 1/sampleTime +1;
timeVector = (0:numberOfSamples) * sampleTime;
Create the data for the two scalar signals. Naming the data variable to match the name of the corresponding signal makes it easier to map data to signals.
signal_1 = timeseries(sin(timeVector)*10,timeVector);
signal_2 = timeseries(rand(size(timeVector)),timeVector);
Create the signals for the bus.
busSignal.busElement_1 = timeseries(cos(timeVector)*2,timeVector);
busSignal.busElement_2 = timeseries(randn(size(timeVector)),timeVector);
Create the bus object for the output data type of the
Bus_1Inport block. You can create the bus object from the bus signal that you defined. Use a bus object for bus signals that cross model reference boundaries.busInfo = Simulink.Bus.createObject(busSignal);
Import and Visualize Workspace Signal Data
Import the signal data that you created from the workspace into the Root Inport Mapper tool. Then you can use the tool to visualize the imported data.
Open the Root Inport Mapper tool. Open the Block Parameters dialog box for one of the Inport blocks in the model and click Connect Inputs.
In the Root Inport Mapper tool, select the From Workspace button.

To clear the data variables, click the Name check box. Then click the check boxes for the
busSignal,signal_1, andsignal_2signals.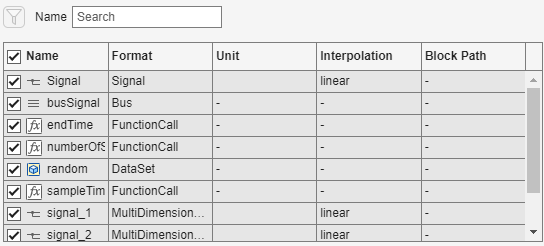
Click OK.
In the Save dialog box, specify a MAT-file to save signals to.
You can visualize signals. In the Root Inport Mapper dialog box toolbar, click Signals > Edit MAT-File.
In the Select Linked MAT-file window, select the MAT-file to which you saved the signals and click OK.
The Signal Editor user interface appears. You can select signals to plot. For example, to see a plot of
signal_1, in the Inputs pane, expand the scenario data set (in this example, the top node,TheModelExample) and then expand thesignal_1entry. To plot the data forsignal_1(1,1,:), double-click the hide icon forsignal_1.
Close the Signal Editor user interface by clicking X.
Map the Data to Inports
After you import the data, you map which data to use for specific Inport blocks.
Select the map mode, which specifies the criteria the mapping uses. In the toolbar, select Map Mode > Signal Name.
The signals in this model have names, so mapping based on signal names makes it very clear which data is going to an Inport block.
You can specify options for the mapping. In the toolbar, select Options > Update Model Automatically, which updates the model after you do the mapping. Compiling the model verifies that signal dimensions and data types match between the data and the Inport blocks.
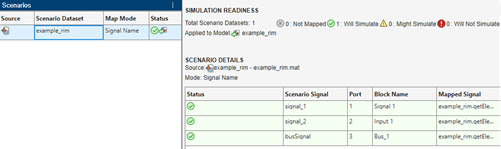
Map the data. In the Scenarios pane, select the scenario data set. In the toolbar, click Check Map Readiness > Selected Scenarios.
The dialog box shows the results of the mapped data.
Tip
Alternatively, in the tree area, right-click and use the context menu to select Check Map Readiness.
Save the Mapping and Data
If you want to reuse the mapping and data that you have set up, you can save it as a
scenario. In the Root Inport Mapper tool, click Save > Save As and save the scenario as an .mldatx file.
Simulate the Model
In the Scenarios pane, select the scenario data set.
In the toolbar, click Apply to Model.
The model is now set up to simulate using the workspace signal data that you mapped to root-level Inport blocks.
Simulate the model.
This model includes a Dashboard block that shows the data used during simulation for
signal_1. The plot matches the plot you did when you visualized the data as part of the data import process.