Knob
Tune parameter value with dial
Libraries:
Simulink /
Dashboard
Description
The Knob block tunes the value of the connected block parameter to during simulation. For example, you can connect the Knob block to a Gain block in your model and adjust its value during simulation. You can modify the range of the Knob block's scale to fit your data. Use the Knob block with other Dashboard blocks to create an interactive dashboard to control your model.
Connect Dashboard Blocks
Dashboard blocks do not use ports to connect to model elements. To connect a dashboard
block, use connect mode. To enter connect mode on an unconnected block, pause on the block
you want to connect and click the Connect button ![]() . To enter connect mode on a connected block, select the
block, pause on the ellipsis that appears (…), and in the action menu that expands, click
the Connect button.
. To enter connect mode on a connected block, select the
block, pause on the ellipsis that appears (…), and in the action menu that expands, click
the Connect button.
To connect a control block to a parameter in your model or to change the connection of a
control block, enter connect mode. Select the block to whose parameter you want to connect.
From the list that appears, select the parameter to which you want to connect. Then, pause
on the dashboard block and click the Done Connecting button ![]() .
.
The control block cannot connect to a parameter whose value is a variable until you update the model diagram. To connect to a parameter whose value is a variable or to modify the value of a variable that is the value of a connected parameter when the simulation is not running, update the model diagram by pressing Ctrl+D.
You can connect to a parameter with a scalar value or to an element of a matrix or structure. For more information, see Connect Dashboard Blocks to Simulink Model.
You can also connect dashboard blocks to a Stateflow® chart. For more information, see Connect Dashboard Blocks to Stateflow (Stateflow).
This animation shows how to connect the Knob block to your model.

Parameter Logging
Tunable parameters connected to dashboard blocks are logged to the Simulation Data
Inspector, where you can view the parameter values along with logged signal data. You can
access logged parameter data in the MATLAB® workspace by exporting the parameter data from the Simulation Data Inspector
by using the UI or the Simulink.sdi.exportRun function. For more information about exporting
data using the Simulation Data Inspector UI, see Export Data From Simulation Data Inspector to Workspace or File. The
parameter data is stored in a Simulink.SimulationData.Parameter object, accessible as an element in the
exported Simulink.SimulationData.Dataset.
Examples
You can use a Knob block to set the value of a parameter to one of several values during simulation. For example, in the model knobGain, a Knob block is connected to the Gain parameter of a Gain block. The Knob block is configured such that you can choose a gain value between 0 and 20.

Simulate the model. To change the gain value during simulation, turn the Knob block.
Extended Examples
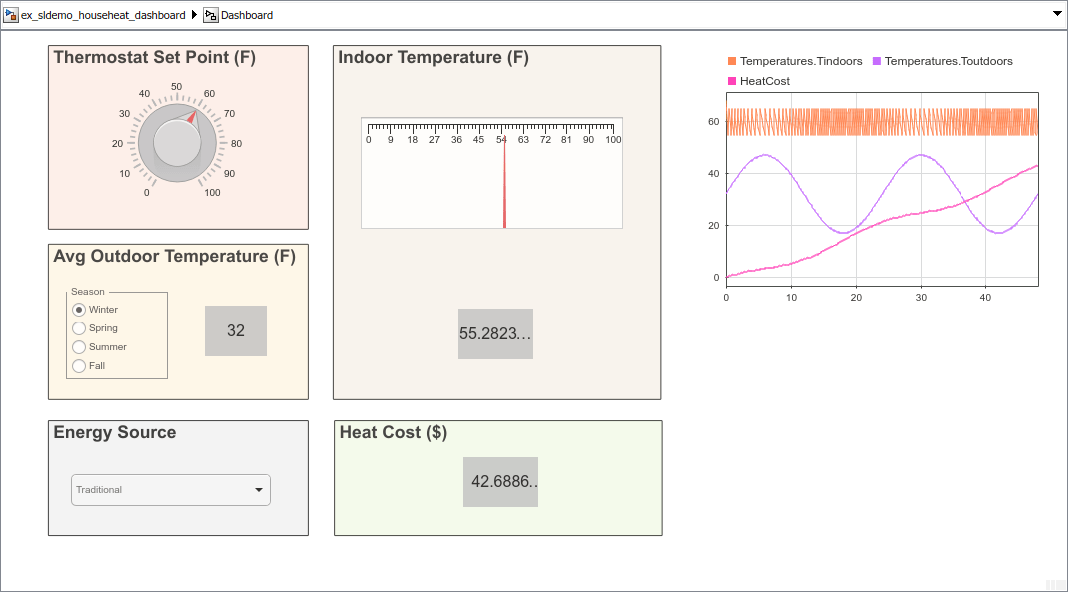
Interactively Simulate Thermal Model of House
Use Dashboard blocks to configure and then interactively simulate a thermal model of a house.

Interactively Simulate Vehicle Climate Control System
Use a dashboard of controls and indicators to interact with the simulation of an automobile climate control system.
Limitations
Except for the Dashboard Scope block and the Display block, dashboard blocks can only connect to real scalar signals.
You cannot use the Connection table in the Block Parameters dialog box to connect a dashboard block to a block that is commented out. When you connect a dashboard block to a commented block using connect mode, the dashboard block does not display the connected value until the you uncomment the block.
Dashboard blocks cannot connect to model elements inside referenced models.
When you simulate a model hierarchy, dashboard blocks inside referenced models do not update.
Dashboard blocks do not support rapid accelerator simulation.
When you connect a dashboard block to a variable or parameter during simulation, the data for that variable or parameter is not logged to the Simulation Data Inspector. To log variable and parameter data to the Simulation Data Inspector, connect the dashboard block to the variable or parameter prior to simulation.
When you simulate a model in external mode with the Default parameter behavior set to Inlined, dashboard blocks can appear to change parameter and variable values. However, the change does not propagate to the simulation. For example, Gain blocks display changes made to the Gain parameter using the dashboard blocks, but the Gain value used in the simulation does not change.
Parameters
Block Characteristics
Data Types |
|
Direct Feedthrough |
|
Multidimensional Signals |
|
Variable-Size Signals |
|
Zero-Crossing Detection |
|
Extended Capabilities
Version History
Introduced in R2015aStarting in R2023b, you can open a dashboard panel in a new window. To do so,
select the panel and pause on the ellipsis that appears. In the action menu that
expands, click the Open In New Window button
![]() .
.
You can minimize and restore the new window containing the panel separately from the model window. From the panel window, you can run, pause, stop, and step through the simulation. In the panel window, you can edit the panel and the blocks it contains.
To return the panel to the model canvas, in the panel window toolstrip, click
Open in canvas
![]() .
.
For more information about opening a panel in a new window, see Open Panels in New Window.