fftshift
Verschieben der Nullfrequenz-Komponente zur Mitte des Spektrums
Beschreibung
Y = fftshift( ordnet eine Fourier-Transformation X)X um, indem die Nullfrequenz-Komponente zur Mitte des Arrays verschoben wird.
Wenn
Xein Vektor ist, tauschtfftshiftdie linke und rechte Hälfte vonX.Wenn
Xeine Matrix ist, tauschtfftshiftden ersten und den dritten Quadranten sowie den zweiten und vierten Quadranten vonX.Wenn
Xein mehrdimensionales Array ist, tauschtfftshiftdie Halbräume vonXentlang jeder Dimension.
Beispiele
Tauschen Sie die linke und rechte Hälfte eines Zeilenvektors. Wenn ein Vektor eine ungerade Anzahl Elemente aufweist, wird das mittlere Element der linken Hälfte des Vektors zugerechnet.
Xeven = [1 2 3 4 5 6];
fftshift(Xeven)
ans = 1×6

     4     5     6     1     2     3
Xodd = [1 2 3 4 5 6 7];
fftshift(Xodd)
ans = 1×7

     5     6     7     1     2     3     4
Bei der Analyse der Frequenzkomponente von Signalen kann es nützlich sein, die Nullfrequenz-Komponenten zur Mitte zu verschieben.
Erstellen Sie ein Signal S, berechnen Sie dessen Fourier-Transformation und plotten Sie die Leistung.
fs = 100;               % sampling frequency
t = 0:(1/fs):(10-1/fs); % time vector
S = cos(2*pi*15*t);
n = length(S);
X = fft(S);
f = (0:n-1)*(fs/n);     %frequency range
power = abs(X).^2/n;    %power
plot(f,power)

Verschieben Sie die Nullfrequenz-Komponenten und plotten Sie die null-zentrierte Leistung.
Y = fftshift(X);
fshift = (-n/2:n/2-1)*(fs/n); % zero-centered frequency range
powershift = abs(Y).^2/n;     % zero-centered power
plot(fshift,powershift)

Sie können mehrere 1D-Signale verarbeiten, indem Sie diese als Zeilen in einer Matrix darstellen. Daraufhin können Sie über das Argument „Dimension“ die Fourier-Transformation berechnen und die Nullfrequenz-Komponenten für jede Zeile verschieben.
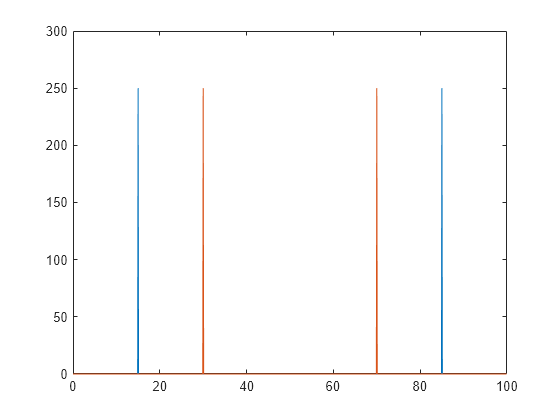
Erstellen Sie eine Matrix A, deren Zeilen zwei 1D-Signale darstellen und berechnen Sie die Fourier-Transformation jedes Signals. Plotten Sie die Leistung jedes Signals.
fs = 100;               % sampling frequency
t = 0:(1/fs):(10-1/fs); % time vector
S1 = cos(2*pi*15*t);
S2 = cos(2*pi*30*t);
n = length(S1);
A = [S1; S2];
X = fft(A,[],2);
f = (0:n-1)*(fs/n);     % frequency range
power = abs(X).^2/n;    % power
plot(f,power(1,:),f,power(2,:))
Verschieben Sie die Nullfrequenz-Komponenten und plotten Sie die null-zentrierte Leistung jedes Signals.
Y = fftshift(X,2);
fshift = (-n/2:n/2-1)*(fs/n); % zero-centered frequency range
powershift = abs(Y).^2/n;     % zero-centered power
plot(fshift,powershift(1,:),fshift,powershift(2,:))

Eingabeargumente
Eingabearray, angegeben als Vektor, Matrix oder mehrdimensionales Array.
Datentypen: double | single | int8 | int16 | int32 | int64 | uint8 | uint16 | uint32 | uint64 | logical
Unterstützung komplexer Zahlen: Ja
Dimension, entlang der die Operation erfolgt, angegeben als positiver ganzzahliger Skalar. Ist kein Wert angegeben, tauscht fftshift entlang aller Dimensionen.
Angenommen, es liegt eine Eingabematrix
Xcvor: Die Operationfftshift(Xc,1)tauscht die Hälften jeder Spalte vonXc.
Angenommen, es liegt eine Matrix
Xrvor: Die Operationfftshift(Xr,2)tauscht die Hälften jeder Zeile vonXr.
Datentypen: double | single | int8 | int16 | int32 | int64 | uint8 | uint16 | uint32 | uint64 | logical
Erweiterte Fähigkeiten
Versionsverlauf
Eingeführt vor R2006a