colormap
Anzeigen und Festlegen der aktuellen Farbtabelle
Syntax
Beschreibung
Festlegen einer Farbtabelle
colormap setzt die Farbtabelle für die aktuelle Abbildung auf die angegebene vordefinierte Farbtabelle. mapcolormap hot setzt beispielsweise die Farbtabelle auf hot.
Wenn Sie die Farbtabelle für die Abbildung festlegen, verwenden die Achsen und Diagramme dieser Abbildung dieselbe Farbtabelle. Die neue Farbtabelle hat dieselbe Länge (Anzahl Farben) wie die aktuelle Farbtabelle. Wenn Sie diese Syntax verwenden, können Sie keine benutzerdefinierte Länge für die Farbtabelle festlegen. Weitere Informationen über Farbtabellen finden Sie im Abschnitt Mehr über.
cmap = colormap(___)cmap als Ausgabeargument fest; verwenden Sie eine der vorherigen Syntaxen mit runden Klammern.
Beispiele
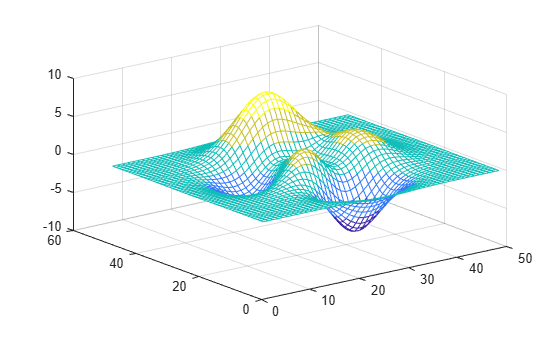
Erstellen Sie ein Oberflächendiagramm und legen Sie als Farbtabelle winter fest.
surf(peaks)
colormap winter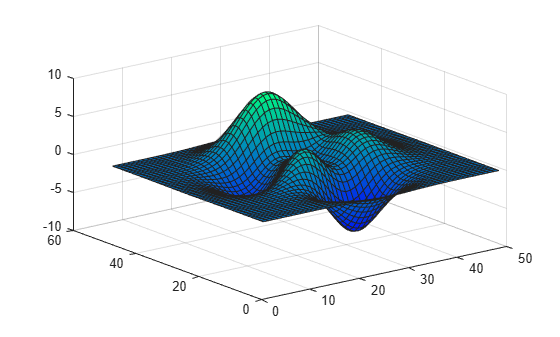
Ändern Sie zunächst die Farbtabelle für die aktuelle Abbildung auf summer.
surf(peaks)
colormap summer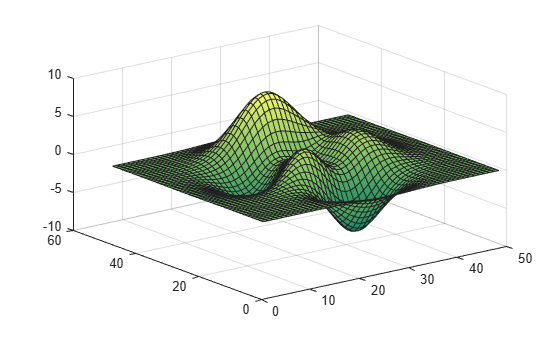
Setzen Sie nun die Farbtabelle wieder auf den Standardwert Ihres Systems. Wenn Sie die Standardeinstellung nicht geändert haben, ist die Standard-Farbtabelle parula.
colormap default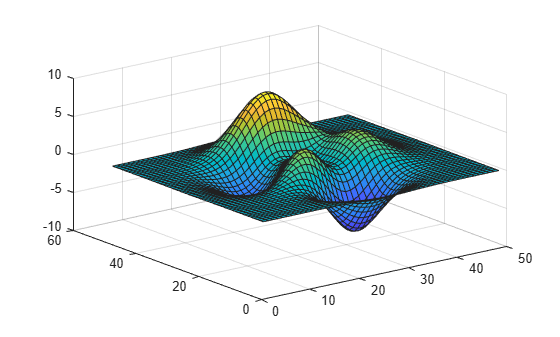
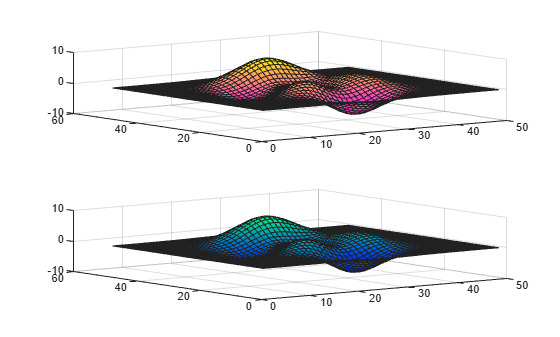
Mithilfe der Funktionen tiledlayout und nexttile können Sie Diagramme gekachelt anzeigen. Rufen Sie die Funktion tiledlayout auf, um ein kachelartiges 2x1-Diagrammlayout zu erstellen. Rufen Sie die nexttile-Funktion auf, um die Achsenobjekte ax1 und ax2 zu erstellen. Übergeben Sie das Achsenobjekt an die colormap-Funktion, um eine andere Farbtabelle für jede Achse festzulegen. Erstellen Sie bei den oberen Achsen ein Oberflächendiagramm mithilfe der Farbtabelle spring. Erstellen Sie bei den unteren Achsen ein Oberflächendiagramm mithilfe der Farbtabelle winter.
tiledlayout(2,1)
ax1 = nexttile;
surf(peaks)
colormap(ax1,spring)

ax2 = nexttile;
surf(peaks)
colormap(ax2,winter)
Sie können die Anzahl Farben in einer Farbtabelle festlegen, indem Sie eine Ganzzahl als Eingabeargument für die eingebaute Farbtabelle verwenden. Verwenden Sie fünf Karten aus der Farbtabelle „parula“.
mesh(peaks)
colormap(parula(5))
Sie können eine benutzerdefinierte Farbtabelle erstellen, indem Sie eine dreispaltige Matrix mit Werten zwischen 0,0 und 1,0 definieren. Jede Zeile definiert ein RGB-Tripel mit drei Elementen. Die erste Spalte legt die Rot-Intensität fest. Die zweite Spalte legt die Grün-Intensität fest. Die dritte Spalte legt die Blau-Intensität fest.
Verwenden Sie eine Farbtabelle mit Blauwerten, indem Sie die ersten zwei Spalten auf null setzen.
map = [0 0 0.3
    0 0 0.4
    0 0 0.5
    0 0 0.6
    0 0 0.8
    0 0 1.0];

surf(peaks)
colormap(map)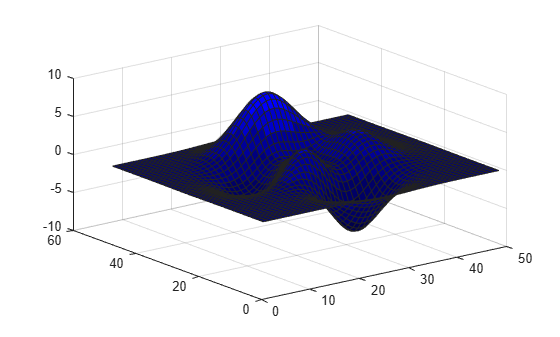
Erstellen Sie ein Oberflächendiagramm der peaks-Funktion und legen Sie eine Farbtabelle fest.
mesh(peaks)
colormap(autumn(5))

Geben Sie die dreispaltige Wertematrix aus, die die im Diagramm verwendeten Farben definiert. Jede Zeile ist ein RGB-Tripel-Farbwert, der eine Farbe der Farbtabelle festlegt.
cmap = colormap
cmap = 5×3

    1.0000         0         0
    1.0000    0.2500         0
    1.0000    0.5000         0
    1.0000    0.7500         0
    1.0000    1.0000         0
Übergeben Sie das Achsenobjekt an die colormap-Funktion, um die Farbtabellenwerte bestimmter Achsen auszugeben.
Erstellen Sie eine gekachelte Ansicht zweier Diagramme, indem Sie die Funktionen tiledlayout und nexttile verwenden. Rufen Sie die Funktion tiledlayout auf, um ein kachelartiges 2x1-Diagrammlayout zu erstellen. Rufen Sie die nexttile-Funktion auf, um die Achsenobjekte ax1 und ax2 zu erstellen. Zeigen Sie daraufhin die zwei ausgefüllten Konturdiagramme mit verschiedenen Farbtabellen an.
tiledlayout(2,1)
ax1 = nexttile;
contourf(peaks)
colormap(ax1,hot(8))

ax2 = nexttile;
contourf(peaks)
colormap(ax2,pink)

Übergeben Sie ax1 an die colormap-Funktion, um die im oberen Diagramm verwendeten Farbtabellenwerte auszugeben. Jede Zeile ist ein RGB-Tripel-Farbwert, der eine Farbe der Farbtabelle festlegt.
cmap = colormap(ax1)
cmap = 8×3

    0.3333         0         0
    0.6667         0         0
    1.0000         0         0
    1.0000    0.3333         0
    1.0000    0.6667         0
    1.0000    1.0000         0
    1.0000    1.0000    0.5000
    1.0000    1.0000    1.0000
Laden Sie den Datensatz spine, der das Bild X und dessen zugehörige Farbtabelle map zurückgibt. Zeigen Sie X mithilfe der image-Funktion an und setzen Sie die Farbtabelle auf map.
load spine
image(X)
colormap(map)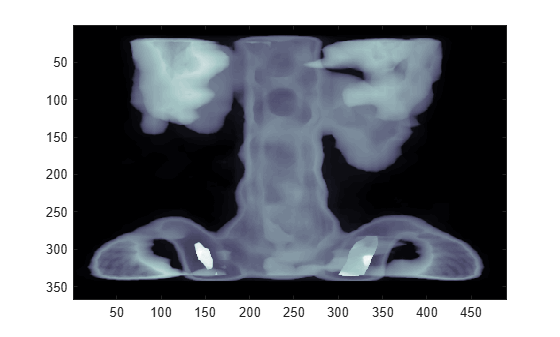
Eingabeargumente
Farbtabelle für das neue Farbschema, angegeben als Name der Farbtabelle, dreispaltige Matrix aus RGB-Tripeln oder 'default'. Ein Farbtabellen-Name legt eine vordefinierte Farbtabelle mit derselben Anzahl Farben wie die aktuelle Farbtabelle fest. Eine dreispaltige Matrix aus RGB-Tripeln legt eine benutzerdefinierte Farbtabelle fest. Sie können die Matrix selbst erstellen oder eine der vordefinierten Farbtabellen-Funktionen aufrufen, um die Matrix zu erstellen. colormap(parula(10)) setzt beispielsweise die Farbtabelle der aktuellen Abbildung auf eine Auswahl von 10 Farben aus der Farbtabelle parula.
Ein Wert von 'default' setzt die Farbtabelle auf die Standard-Farbtabelle für das Zielobjekt.
Name der Farbtabelle
Die vordefinierten Farbtabellen sind in der folgenden Tabelle aufgeführt.
| Name der Farbtabelle | Farbskala |
|---|---|
|
|
|
|
|
|
|
|
|
|
|
|
|
|
|
|
|
|
|
|
|
|
|
|
|
|
|
|
|
|
|
|
|
|
|
|
|
|
|
|
|
|
|
|


Dreispaltige Matrix
Um eine benutzerdefinierte Farbtabelle zu erstellen, legen Sie map als dreispaltige Matrix aus RGB-Tripeln fest, wobei jede Zeile eine Farbe festlegt. Ein RGB-Tripel ist ein aus drei Elementen bestehender Zeilenvektor, dessen Elemente die Intensitäten der Rot-, Grün- und Blaukomponenten der Farbe angeben. Die Intensitäten können double- oder single-Werte im Bereich [0;1] oder uint8-Werte im Bereich [0;255] sein. Diese Matrix legt beispielsweise eine Farbtabelle mit fünf Farben fest.
map = [0.2 0.1 0.5
    0.1 0.5 0.8
    0.2 0.7 0.6
    0.8 0.7 0.3
    0.9 1 0];
Diese Tabelle führt die RGB-Tripelwerte für häufige Farben auf.
| Farbe | double- oder single-RGB-Tripel | uint8-RGB-Tripel |
|---|---|---|
| gelb | [1 1 0] | [255 255 0] |
| magenta | [1 0 1] | [255 0 255] |
| cyan | [0 1 1] | [0 255 255] |
| rot | [1 0 0] | [255 0 0] |
| grün | [0 1 0] | [0 255 0] |
| blau | [0 0 1] | [0 0 255] |
| weiß | [1 1 1] | [255 255 255] |
| schwarz | [0 0 0] | [0 0 0] |
Datentypen: char | double | single | uint8
Ziel, angegeben als einer dieser Werte:
Figure-Objekt. Die Abbildungs-Farbtabelle gilt für Diagramme auf allen Achsen in der Abbildung.Axes-Objekt,PolarAxes-Objekt oderGeographicAxes-Objekt. Sie können für die verschiedenen Achsen einer Abbildung eine einzigartige Farbtabelle festlegen.Eigenständige Visualisierung mit der Eigenschaft
Colormap. Sie können beispielsweise die Farbtabelle einesHeatmapChart-Objekts ändern oder abfragen.
Ausgabeargumente
Mehr über
Eine Farbtabelle ist eine Wertematrix, die die Farben von grafischen Objekten wie Oberflächen, Bilder und Patch Objects definiert. MATLAB® stellt die Objekte dar, indem Datenwerte Farben in der Farbtabelle zugeordnet werden.
Farbtabellen können eine beliebige Länge aufweisen, müssen jedoch drei Spalten breit sein. Jede Zeile der Matrix definiert eine Farbe anhand eines RGB-Tripels. Ein RGB-Tripel ist ein aus drei Elementen bestehender Zeilenvektor, dessen Elemente die Intensitäten der Rot-, Grün- und Blaukomponenten der Farbe angeben. Üblicherweise sind die Intensitäten double- oder single-Werte im Bereich [0;1]. Ein Wert von 0 gibt keine Farbe an, ein Wert 1 maximale Intensität. Beispielsweise erstellt dieser Befehl eine Farbtabelle mit fünf Farben: Schwarz, rot, grün, blau und weiß.
mymap = [0 0 0
    1 0 0
    0 1 0
    0 0 1
    1 1 1];
Um das Farbschema einer Visualisierung zu ändern, rufen Sie die colormap-Funktion auf, um die Farbtabelle der übergeordneten Achsen oder Abbildung zu ändern. Beispielsweise erstellen diese Befehle ein Oberflächendiagramm und setzen die Farbtabelle der Abbildung auf mymap.
surf(peaks)
colormap(mymap)

Tipps
Verwenden Sie die
clim-Funktion, um die Grenzwerte der Farbtabelle und die Beziehung zwischen den Grenzwerten und dem Bereich Ihrer Daten zu steuern.Vor R2022a: Verwenden Sie
caxis; Syntax und Argumente sind zuclimidentisch.