colorbar
R2026bColorbar showing color scale
Syntax
Description
colorbar displays a vertical colorbar to the right of the
current axes or chart. Colorbars display the current colormap and indicate the
mapping of data values into the colormap.
colorbar(___,
modifies the colorbar appearance using one or more name-value arguments. For
example, Name=Value)Direction="reverse" reverses the color scale.
Specify Name=Value as the last arguments in any of the
previous syntaxes. Not all types of charts support modifying the colorbar
appearance.
colorbar(
adds a colorbar to the axes or chart specified by target,___)target.
Specify the target axes or chart as the first argument in any of the previous
syntaxes.
c = colorbar(___) returns the ColorBar object. You can use this object to set
properties after creating the colorbar. Specify the return argument
c with any of the previous syntaxes.
Examples
Add a colorbar to a surface plot indicating the color scale.
surf(peaks)
colorbar
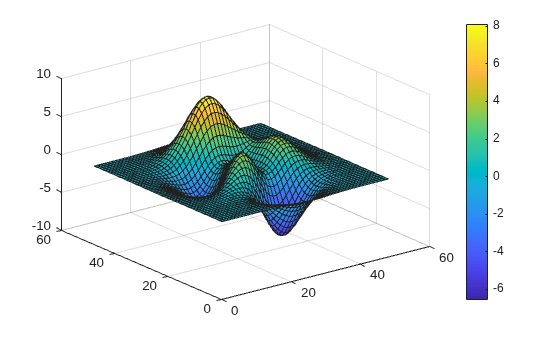
By default, the colorbar function adds a vertical colorbar to the right side of the graph.
Add a horizontal colorbar below a plot by specifying the colorbar location as "southoutside".
contourf(peaks)
colorbar("southoutside")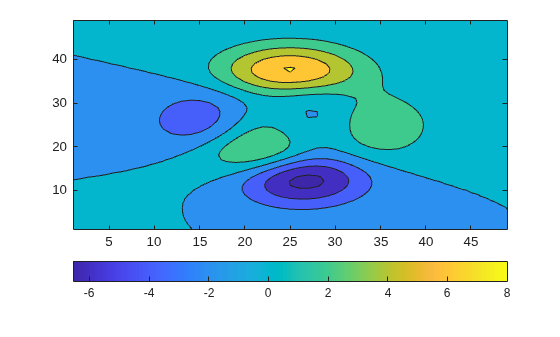
Reverse the direction of values in a colorbar on a graph by setting the Direction property of the colorbar to "reverse".
surf(peaks)
colorbar(Direction="reverse")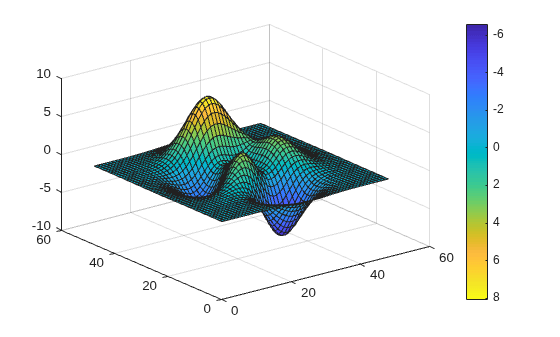
The colorbar values ascend from top to bottom instead of ascending from bottom to top.
Display the colorbar tick marks and tick labels on the side of a colorbar facing the surface plot.
surf(peaks)
colorbar(AxisLocation="in")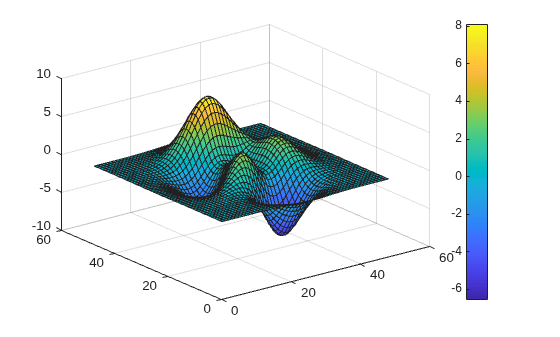
Call the tiledlayout function to create a 2-by-1 tiled chart layout. Call the nexttile function to create the axes. Then display a surface plot in each axes with a colorbar.
tiledlayout(2,1)

% Top plot
nexttile
surf(peaks)
colorbar

% Bottom plot
nexttile
mesh(peaks)
colorbar
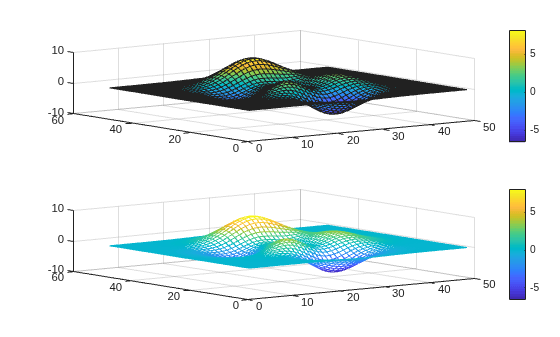
When you want to share a colorbar between two or more plots, you can display the colorbar in a separate tile of the layout.
Create filled contour plots of the peaks and membrane data sets in a tiled chart layout.
Z1 = peaks;
Z2 = membrane;
tiledlayout(2,1);
nexttile
contourf(Z1)
nexttile
contourf(Z2)
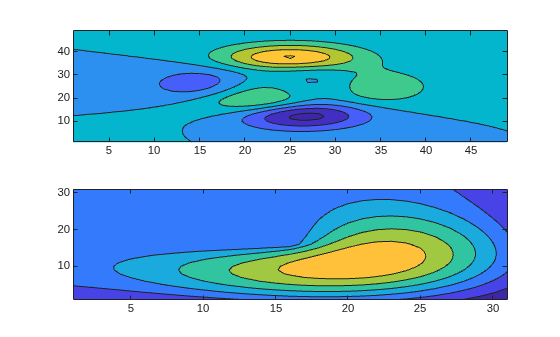
Add a colorbar, and move it to the east tile.
cb = colorbar;
cb.Layout.Tile = 'east';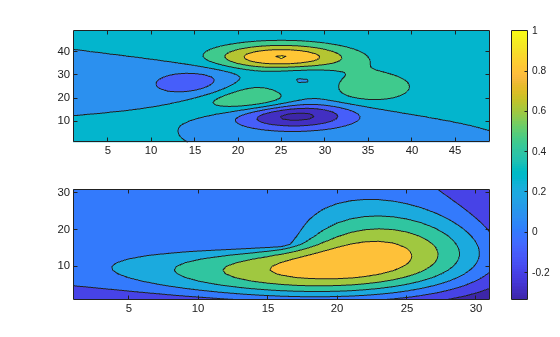
Add a colorbar to a plot and specify the colorbar tick marks and tick labels. Specify the same number of tick labels as tick marks. If you do not specify enough tick labels, then the colorbar function repeats the labels.
contourf(peaks)
colorbar(Ticks=[-5 -2 1 4 7],...
         TickLabels=["Cold" "Cool" "Neutral" "Warm" "Hot"])
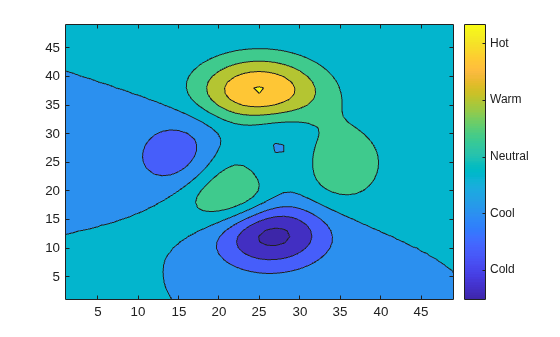
Add a text label along a colorbar.
surf(peaks)
c = colorbar;
c.Label.String = 'Elevation (ft in 1000s)';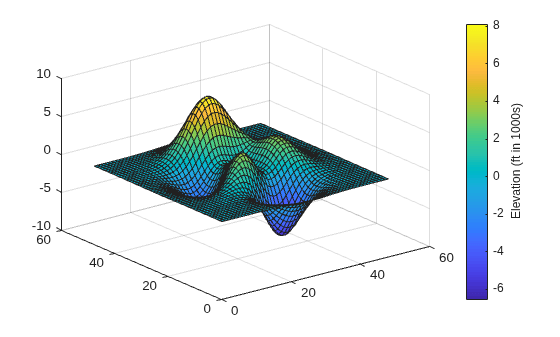
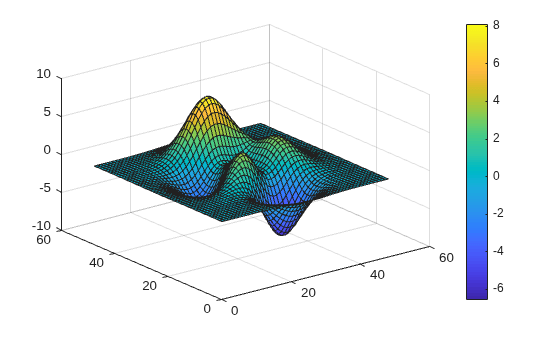
Add a colorbar to a surface plot.
surf(peaks)
colorbar
Delete the colorbar from the surface plot.
colorbar('off')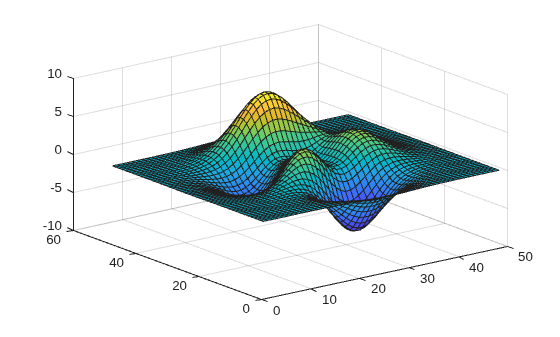
Input Arguments
Name-Value Arguments
Tips
To add a text description along the colorbar, access the underlying text object using the
Labelproperty of the colorbar.c.Label.String = "My Colorbar Label";To change the label appearance, such as the font style or color, set other text properties. For a list of properties, see Text Properties. For example, this code changes the font size.
c.Label.FontSize = 12;
Adding a colorbar might resize the axes to accommodate the colorbar.
If an axes does not exist, then the
colorbarfunction creates a blank axes and displays a colorbar with the default colormap.You can use
colorbar('delete')orcolorbar('hide')instead ofcolorbar('off')to delete all colorbars in the current axes. All of these commands are equivalent.

