area
Filled area 2-D plot
Syntax
Description
Vector and Matrix Data
area( plots the
values in X,Y)Y against the x-coordinates
X. The function then fills the areas between the curves based on the
shape of Y:
If
Yis a vector, the plot contains one curve.areafills the area between the curve and the horizontal axis.If
Yis a matrix, the plot contains one curve for each column inY.areafills the areas between the curves and stacks them, showing the relative contribution of each row element to the total height at each x-coordinate.
Table Data
area(
plots the variables tbl,xvar,yvar)xvar and yvar from the table
tbl. To plot one curve, specify one variable for
xvar and one variable for yvar. To plot multiple
curves, specify multiple variables for xvar, yvar,
or both. If both arguments specify multiple variables, they must specify the same number
of variables. (since R2026a)
Additional Options
area(___, modifies
the properties of the area plot using one or more name-value pair arguments. The
properties apply to all of the displayed areas. For example,
Name=Value)area(X,Y,LineStyle="--") specifies a dashed line style for the plot.
Specify the name-value arguments after all of the arguments in any of the previous
syntaxes. For a list of properties, see Area Properties.
area( displays the area
plot in the target axes. Specify the axes as the first argument in any of the previous
syntaxes.ax,___)
a = area(___) returns one or more
Area objects. The number of objects is equal to the number of plotted
areas. Use a to modify properties of the areas after creating them. For
a list of properties, see Area Properties.
Examples
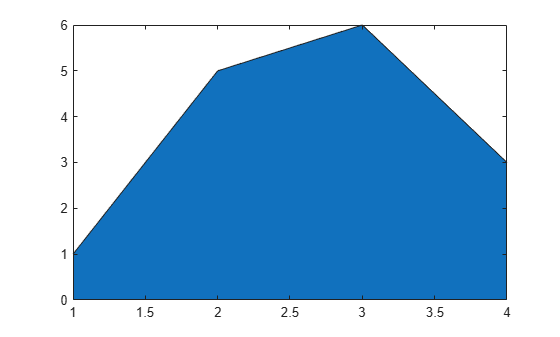
Create a vector of four values. Display the values in an area plot.
y = [1 5 6 3];
area(y)
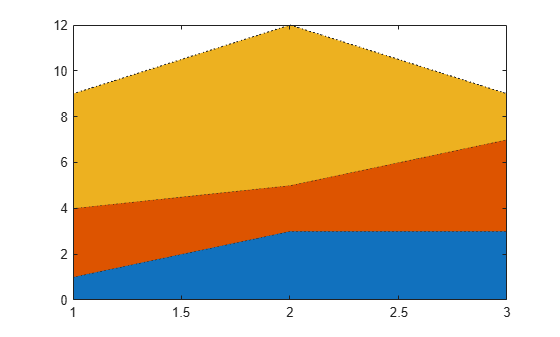
Create matrix Y. Then display the values in Y as an area plot. Because Y contains three columns, area plots three curves and stacks them.
Y = [1 5 3; 3 2 7; 1 5 3; 2 6 1];
area(Y)

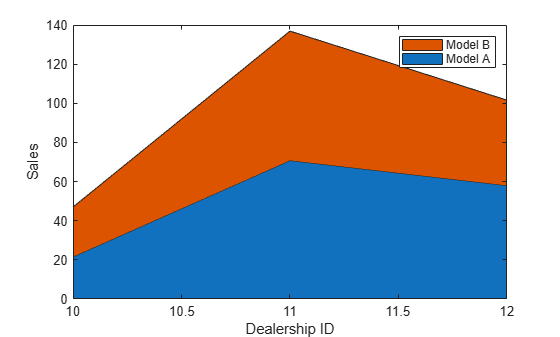
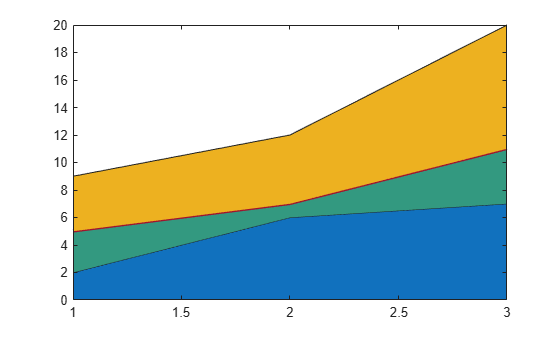
Define x as a vector of three car dealership IDs. Define Y as a matrix containing the number of cars sold per model. Display the values in the matrix in an area plot. Then add the axis labels and a legend.
x = [10 11 12];
Y = [21.6 25.4; 70.8 66.1; 58.0 43.6];
area(x,Y)
xlabel('Dealership ID')
ylabel('Sales')
legend({'Model A','Model B'})
Set the tick marks along the x-axis to correspond to the values in x.
ax = gca; % current axes
ax.XTick = x;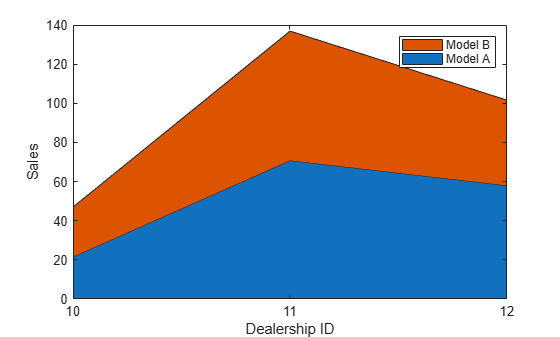
Since R2026a
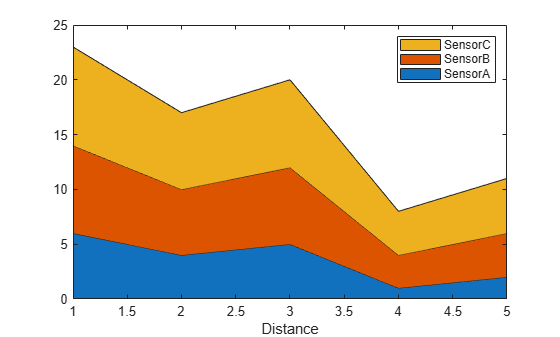
Create a table that has four variables and plot the variables. Then add a legend. By default, the x-axis labels and legend display the variable names.
Distance = (1:5)';
SensorA = [6; 4; 5; 1; 2];
SensorB = SensorA + 2;
SensorC = SensorA + 3;
tbl = table(Distance,SensorA,SensorB,SensorC);
area(tbl,"Distance",["SensorA","SensorB","SensorC"]);
legend
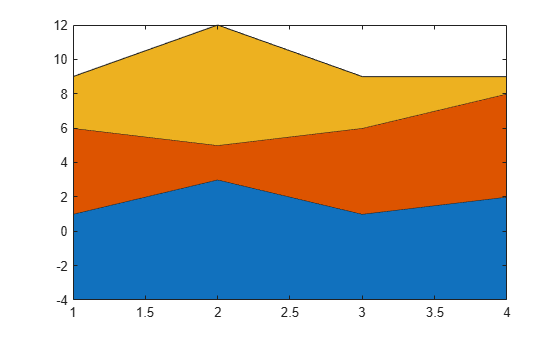
Create matrix Y. Then display the values of Y in an area plot with a baseline value of -4. area fills the areas specified by the curves and the line y = -4.
Y = [1 5 3; 3 2 7; 1 5 3; 2 6 1];
basevalue = -4;
area(Y,basevalue)
Create matrix Y. Display the values of Y in an area plot that uses a dotted line style.
Y = [1 3 5; 3 2 7; 3 4 2];
area(Y,'LineStyle',':')
Create a tiled chart layout in the 'flow' tile arrangement, so that the axes fill the available space in the layout. Next, call the nexttile function to create an Axes object and return it as ax1. Display an area plot by passing ax1 to the area function.
tiledlayout('flow')
ax1 = nexttile;
Y1 = [3 6; 1 5; 7 2; 5 9];
area(ax1,Y1)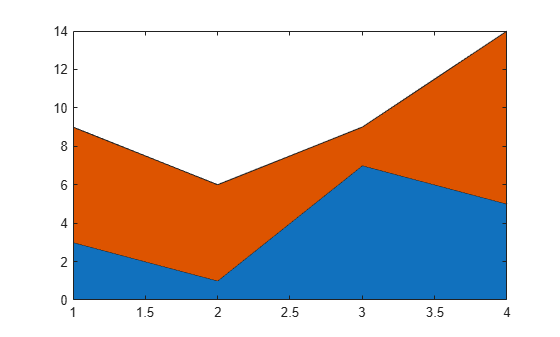
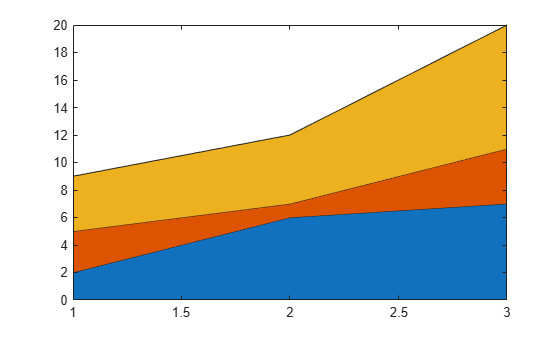
Repeat the process to create a second Axes object and a second area plot.
ax2 = nexttile;
Y2 = [4 2 11; 5 6 0; 1 7 2; 9 5 9];
area(ax2,Y2)

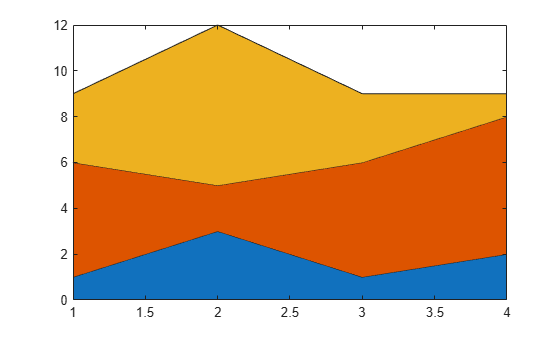
Create matrix Y. Then create an area plot, specifying an output argument when calling the area function. In this case, area returns a vector of three Area objects. Each object corresponds to a different column of Y.
Y = [2 3 4; 6 1 5; 7 4 9];
a = area(Y);
Modify the second area to be green with thick red edges.
a(2).FaceColor = [0.2 0.6 0.5];
a(2).EdgeColor = [0.63 0.08 0.18];
a(2).LineWidth = 2;
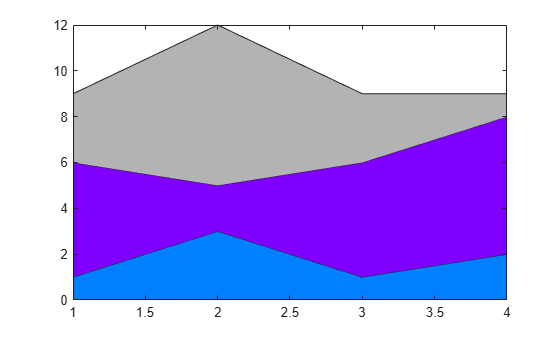
Display an area plot with three curves.
area([1 5 3; 3 2 7; 1 5 3; 2 6 1])
Set the color order to blue, purple, and gray.
newcolors = [0 0.5 1; 0.5 0 1; 0.7 0.7 0.7];
colororder(newcolors)
Input Arguments
Name-Value Arguments
Specify optional pairs of arguments as
Name1=Value1,...,NameN=ValueN, where Name is
the argument name and Value is the corresponding value.
Name-value arguments must appear after other arguments, but the order of the
pairs does not matter.
Example: area([1 2 3],FaceColor="red") specifies a red fill color for
the area plot.
Note
The properties listed here are only a subset. For a complete list, see Area Properties.
Area fill color, specified as an RGB triplet, a hexadecimal color code, a color name, or
"flat".
For a custom color, specify an RGB triplet or a hexadecimal color code.
An RGB triplet is a three-element row vector whose elements specify the intensities of the red, green, and blue components of the color. The intensities must be in the range
[0,1], for example,[0.4 0.6 0.7].A hexadecimal color code is a string scalar or character vector that starts with a hash symbol (
#) followed by three or six hexadecimal digits, which can range from0toF. The values are not case sensitive. Therefore, the color codes"#FF8800","#ff8800","#F80", and"#f80"are equivalent.
Alternatively, you can specify some common colors by name. This table lists the named color options, the equivalent RGB triplets, and the hexadecimal color codes.
| Color Name | Short Name | RGB Triplet | Hexadecimal Color Code | Appearance |
|---|---|---|---|---|
"red" | "r" | [1 0 0] | "#FF0000" |
|
"green" | "g" | [0 1 0] | "#00FF00" |
|
"blue" | "b" | [0 0 1] | "#0000FF" |
|
"cyan"
| "c" | [0 1 1] | "#00FFFF" |
|
"magenta" | "m" | [1 0 1] | "#FF00FF" |
|
"yellow" | "y" | [1 1 0] | "#FFFF00" |
|
"black" | "k" | [0 0 0] | "#000000" |
|
"white" | "w" | [1 1 1] | "#FFFFFF" |
|
"none" | Not applicable | Not applicable | Not applicable | No color |
This table lists the default color palettes for plots in the light and dark themes.
| Palette | Palette Colors |
|---|---|
Before R2025a: Most plots use these colors by default. |
|
|
|
You can get the RGB triplets and hexadecimal color codes for these palettes using the orderedcolors and rgb2hex functions. For example, get the RGB triplets for the "gem" palette and convert them to hexadecimal color codes.
RGB = orderedcolors("gem");
H = rgb2hex(RGB);
Before R2023b: Get the RGB triplets using RGB =
get(groot,"FactoryAxesColorOrder").
Before R2024a: Get the hexadecimal color codes using H =
compose("#%02X%02X%02X",round(RGB*255)).
Area outline color, specified as an RGB triplet, a hexadecimal color code, a color name, or
"flat". Specifying this property as "flat"
uses the colors of the colormap.
For a custom color, specify an RGB triplet or a hexadecimal color code.
An RGB triplet is a three-element row vector whose elements specify the intensities of the red, green, and blue components of the color. The intensities must be in the range
[0,1], for example,[0.4 0.6 0.7].A hexadecimal color code is a string scalar or character vector that starts with a hash symbol (
#) followed by three or six hexadecimal digits, which can range from0toF. The values are not case sensitive. Therefore, the color codes"#FF8800","#ff8800","#F80", and"#f80"are equivalent.
Alternatively, you can specify some common colors by name. This table lists the named color options, the equivalent RGB triplets, and the hexadecimal color codes.
| Color Name | Short Name | RGB Triplet | Hexadecimal Color Code | Appearance |
|---|---|---|---|---|
"red" | "r" | [1 0 0] | "#FF0000" |
|
"green" | "g" | [0 1 0] | "#00FF00" |
|
"blue" | "b" | [0 0 1] | "#0000FF" |
|
"cyan"
| "c" | [0 1 1] | "#00FFFF" |
|
"magenta" | "m" | [1 0 1] | "#FF00FF" |
|
"yellow" | "y" | [1 1 0] | "#FFFF00" |
|
"black" | "k" | [0 0 0] | "#000000" |
|
"white" | "w" | [1 1 1] | "#FFFFFF" |
|
"none" | Not applicable | Not applicable | Not applicable | No color |
This table lists the default color palettes for plots in the light and dark themes.
| Palette | Palette Colors |
|---|---|
Before R2025a: Most plots use these colors by default. |
|
|
|
You can get the RGB triplets and hexadecimal color codes for these palettes using the orderedcolors and rgb2hex functions. For example, get the RGB triplets for the "gem" palette and convert them to hexadecimal color codes.
RGB = orderedcolors("gem");
H = rgb2hex(RGB);
Before R2023b: Get the RGB triplets using RGB =
get(groot,"FactoryAxesColorOrder").
Before R2024a: Get the hexadecimal color codes using H =
compose("#%02X%02X%02X",round(RGB*255)).
Line style, specified as one of the options listed in this table.
| Line Style | Description | Resulting Line |
|---|---|---|
"-" | Solid line |
|
"--" | Dashed line |
|
":" | Dotted line |
|
"-." | Dash-dotted line |
|
"none" | No line | No line |
Area outline width, specified as a scalar numeric value in point units. One point equals 1/72 inch.
Example: 1.5
Data Types: single | double | int8 | int16 | int32 | int64 | uint8 | uint16 | uint32 | uint64
Tips
areauses colors based on theColorOrderproperty of the axes. It cycles through all colors, and then it repeats the cycle if you plot more filled regions than there are colors.You can change the colors after plotting by setting the
ColorOrderproperty on the axes. You can also call thecolororderfunction to change the color order for all the axes in the figure.