geolimits
Set or query geographic limits
Syntax
Description
Specify Limits
geolimits(
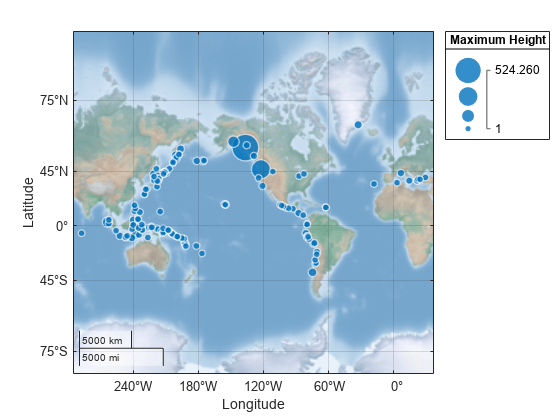
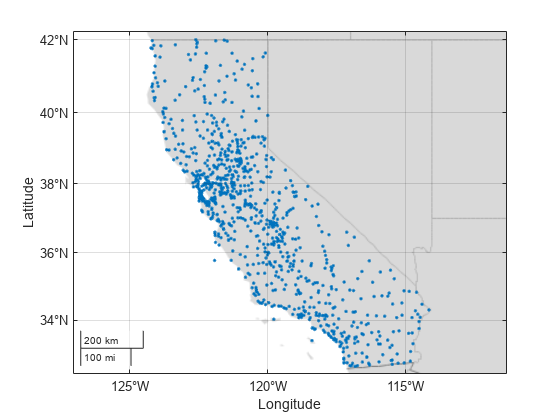
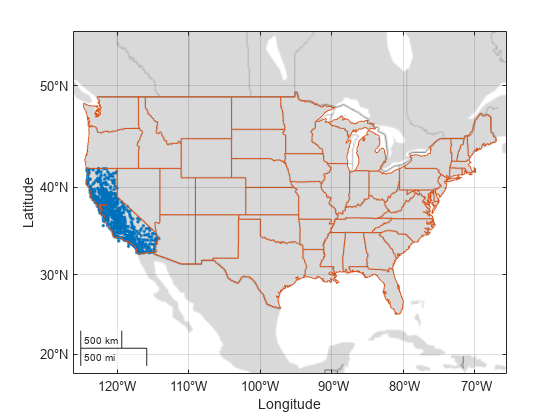
adjusts the limits of the current geographic axes, geographic bubble chart, or
map axes to include the latitude and longitude limits specified by
latlim,lonlim)latlim and lonlim, respectively.
If the current axes is not a geographic axes, a geographic bubble chart, or a
map axes, or if there is no current axes, then the function creates a new
geographic axes with the specified limits.
Note
The geolimits function typically uses wider
limits than the limits you specify to maintain the aspect ratio of the
map.
geolimits( specifies
automatic or manual limit selection. You can specify
limitmode)limitmode as one of these values:
"auto"— Enable automatic limit selection. MATLAB® selects the limits based on the range of your data. If you plot into the axes or chart multiple times, the limits update to encompass all the data."manual"— Preserve the current limits as closely as possible.
You can specify the limitmode argument without
parentheses. For example, geolimits auto enables automatic
limit selection.
Query Limits
Specify Target Axes or Chart
[___] = geolimits(
uses the axes or chart specified by ax,___)ax.
Examples
Input Arguments
Output Arguments
Tips
For map axes, the function can include areas surrounding the quadrangle defined by
latlim and lonlim. For information about
displaying data only within the quadrangle, see Create Map of Quadrangle Using Cartographic Map Layout (Mapping Toolbox).
Version History
Introduced in R2017b
See Also
Functions
Properties
- GeographicAxes Properties | GeographicBubbleChart Properties | MapAxes Properties (Mapping Toolbox)
1 Alignment of boundaries and region labels are a presentation of the feature provided by the data vendors and do not imply endorsement by MathWorks®.


