Customize Appearance of Geographic Axes
Geographic axes are a type of axes, similar to Cartesian axes and polar axes. As a result, you can use many MATLAB® graphics functions with geographic axes. This example shows how to customize geographic axes by changing the geographic limits, the tick label format, the tick value locations, the axis and title colors, and the grid line appearance.
By default, most plotting functions reset many of the axes properties. This example customizes the properties of the axes after plotting the data. To customize the axes before plotting the data, set the hold state of the axes to on by using the hold function.
Create Map
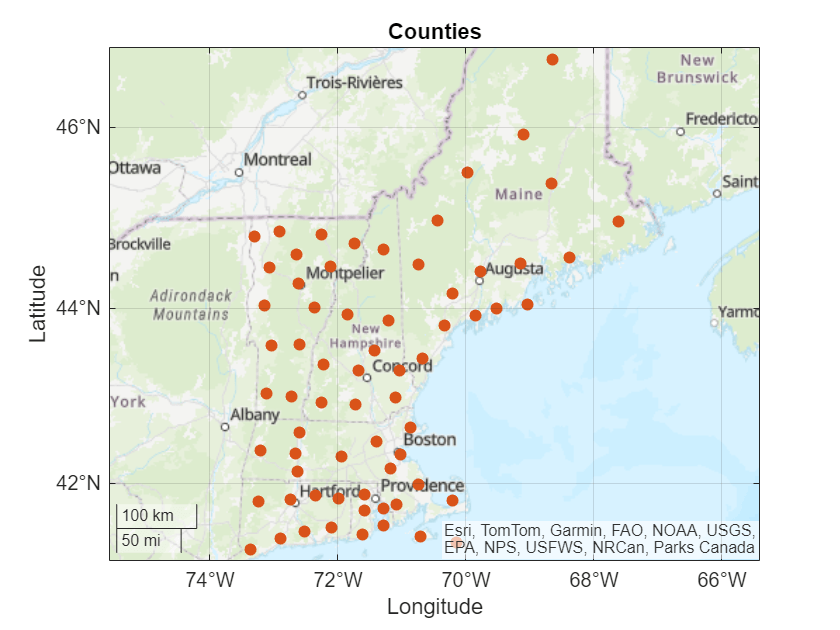
Load a table containing county data into the workspace. Extract the latitude and longitude coordinates from the table. Then, display the coordinates by using the geoscatter function. The function displays the coordinates by creating a geographic axes. Add a title and change the basemap.
counties = readtable("counties.xlsx");
lat = counties.Latitude;
lon = counties.Longitude;

figure
geoscatter(lat,lon,"filled",MarkerFaceColor=[0.8500 0.3250 0.0980])

title("Counties")
geobasemap topographic
Change Geographic Limits
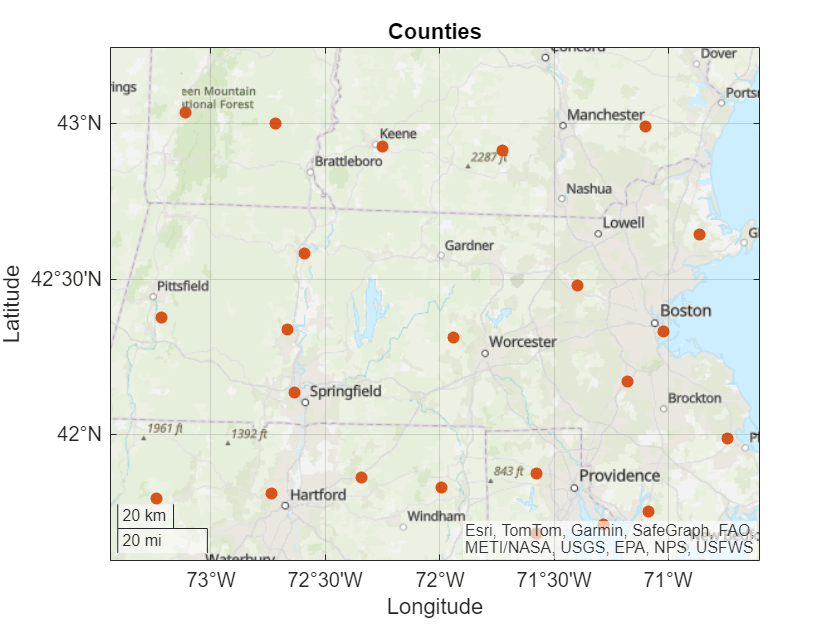
Change the latitude and longitude limits by using the geolimits function.
geolimits([41.59 43.24],[-73.79 -70.25])
Change Tick Label Format
Change the format of the tick labels by using the geotickformat function. The option dd changes the tick label format to decimal degrees.
geotickformat dd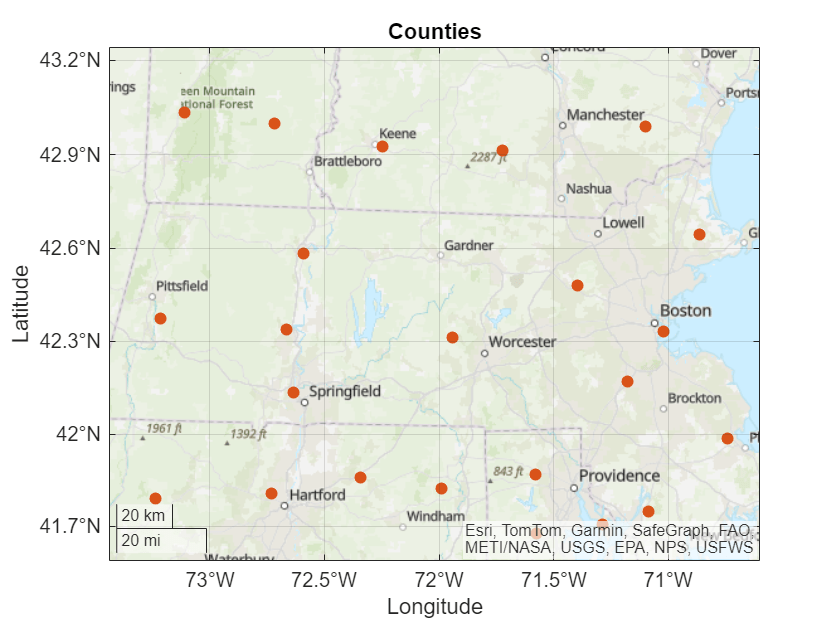
Change Tick Value Locations
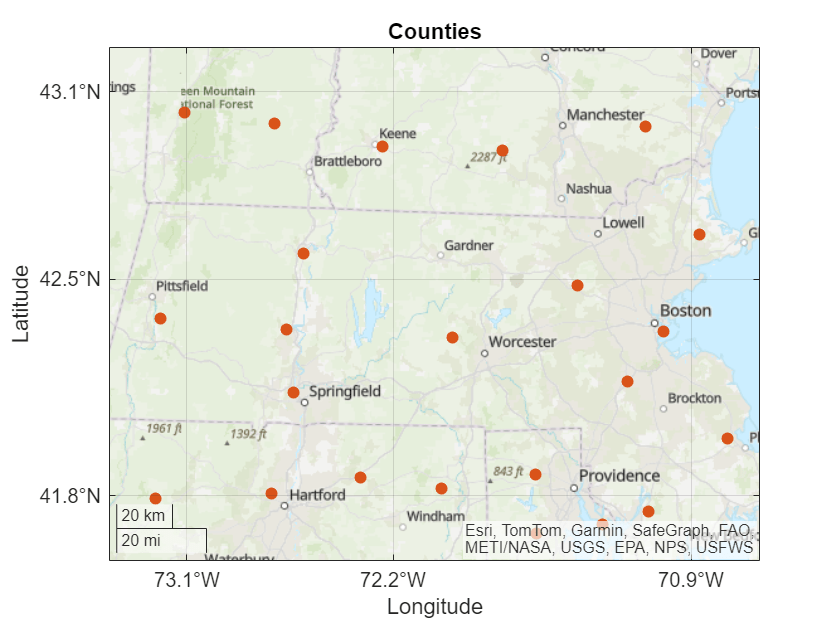
GeographicAxes objects have properties that you can use to customize the appearance of the axes. For example, the LatitudeAxis and LongitudeAxis properties of the axes store ruler objects that control the latitude axis and longitude axis, respectively.
Access the GeographicAxes object. Then, change the tick value locations by setting the TickValues properties of the ruler objects. The locations do not need to be evenly spaced.
gx = gca;
gx.LatitudeAxis.TickValues = [41.8 42.5 43.1];
gx.LongitudeAxis.TickValues = [-73.1 -72.2 -70.9];
Change Colors
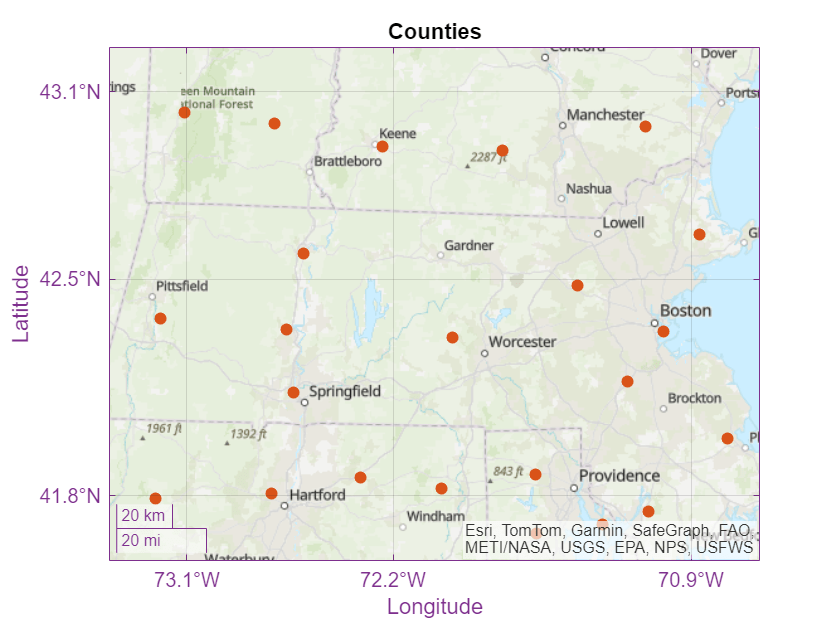
Change the color of the axis lines, ticks, and labels by setting the AxisColor property of the geographic axes.
gx.AxisColor = [0.4940 0.1840 0.5560];
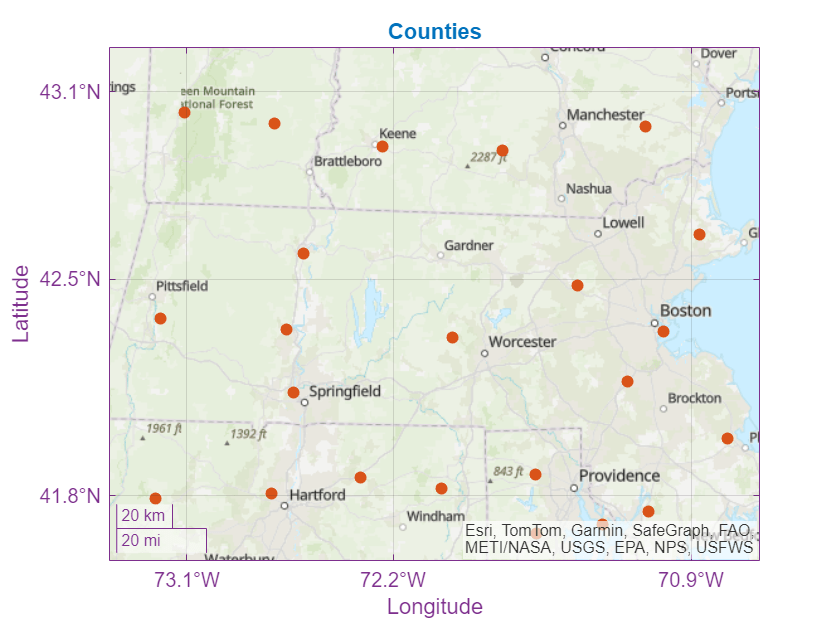
Change the color of the title by setting the Color property of the title.
gx.Title.Color = [0 0.4470 0.7410];
Change Appearance of Grid Lines
Change the color, line style, and transparency of the grid lines by changing the GridColor, GridLineStyle, and GridAlpha properties of the axes, respectively.
gx.GridColor = [0.4940 0.1840 0.5560];
gx.GridLineStyle = "--";
gx.GridAlpha = 0.9;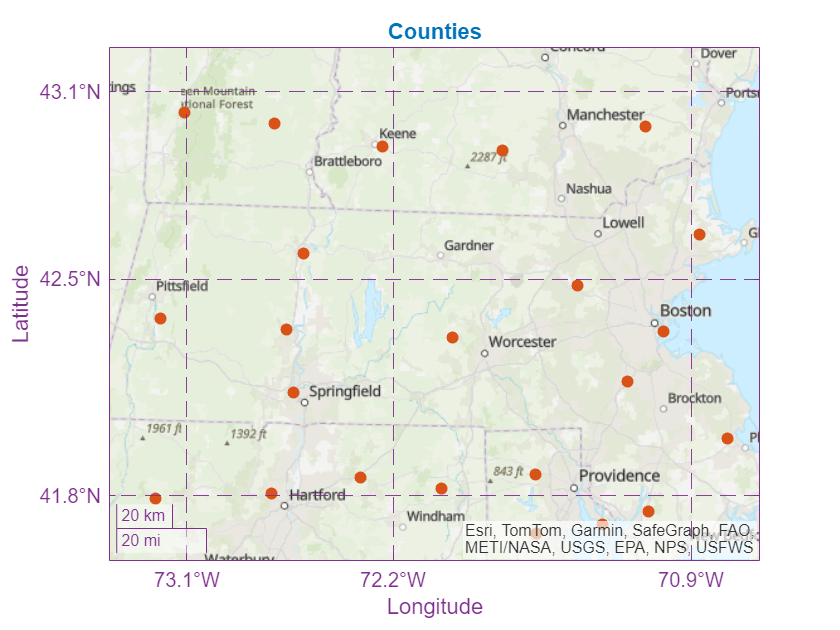
Remove the grid lines by using the grid function.
grid off