Interact with Geographic Axes
This topic describes how to explore geographic axes and charts, how to interactively find the latitude-longitude coordinates of locations on maps, and how to interactively select the locations for text on maps.
Explore Geographic Axes and Charts
You can explore geographic axes and charts by panning and zooming. Panning and zooming can improve the visual display of your data or reveal additional information about your data.
Pan by dragging or by using the arrow keys. You can pan continuously in the horizontal direction. You can pan north to about 85 degrees, and you can pan south to about –85 degrees.
Zoom by scrolling or by using the Plus and Minus keys.
For more information about controlling the interactivity of axes, see Control Chart Interactivity.
Geographic axes and charts use a Web Mercator projection. As a result:
In most cases, the latitude limits of geographic axes and charts do not extend outside of the range [–85, 85] degrees. The latitude limits can extend outside of this range when you set the
MapCenterandZoomLevelproperties of the axes or chart.Displaying data values outside of the range [–85, 85] degrees is impractical because the Web Mercator projection drastically distorts the distances between such data values.
Geographic axes and charts do not display data values that are close to 90 degrees and –90 degrees because the Web Mercator projection projects such data values to near-infinite or infinite locations on the map.
Mapping Toolbox™ enables you to display data using other types of projections. For more information about creating map displays using Mapping Toolbox, see Choose a 2-D Map Display (Mapping Toolbox).
Interactively Identify Geographic Coordinates
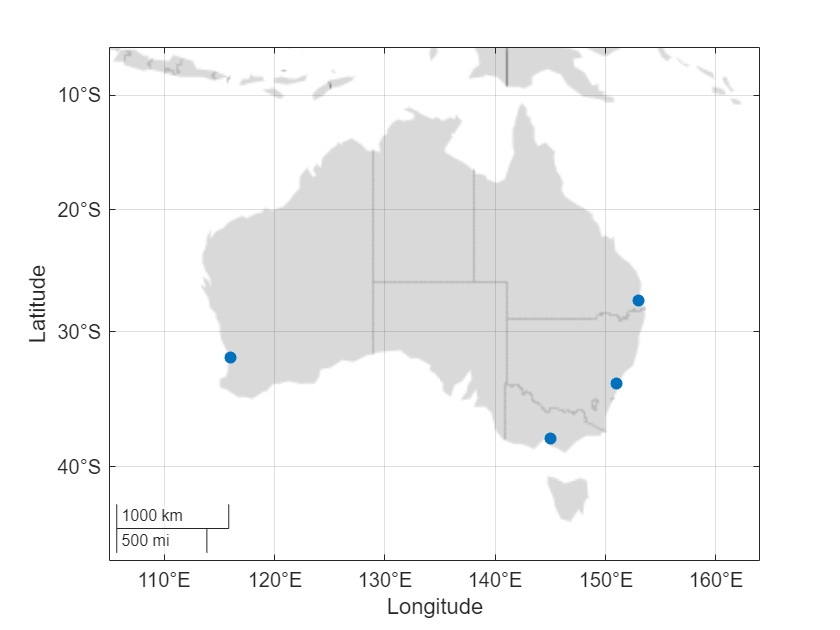
Interactively find the latitude-longitude coordinates of locations on a map by using geographic axes and the ginput function.
Create a map of Australia that uses the grayland basemap.
figure
geobasemap grayland
geolimits([-46 -6],[98 170])
Identify the coordinates of four locations.
To interactively select the locations, specify
interactivelySelectLocationsastrue. Specify the number of locations as input to theginputfunction.To use predefined points, specify
interactivelySelectLocationsasfalse.
interactivelySelectLocations =false; if interactivelySelectLocations [lat,lon] = ginput(4); else lat = [-34 -38 -27.5 -32]; lon = [151 145 153 116]; end
Display the locations on the map. Preserve the geographic limits by setting the hold state to on.
hold on
geoscatter(lat,lon,"filled")
Interactively Display Text
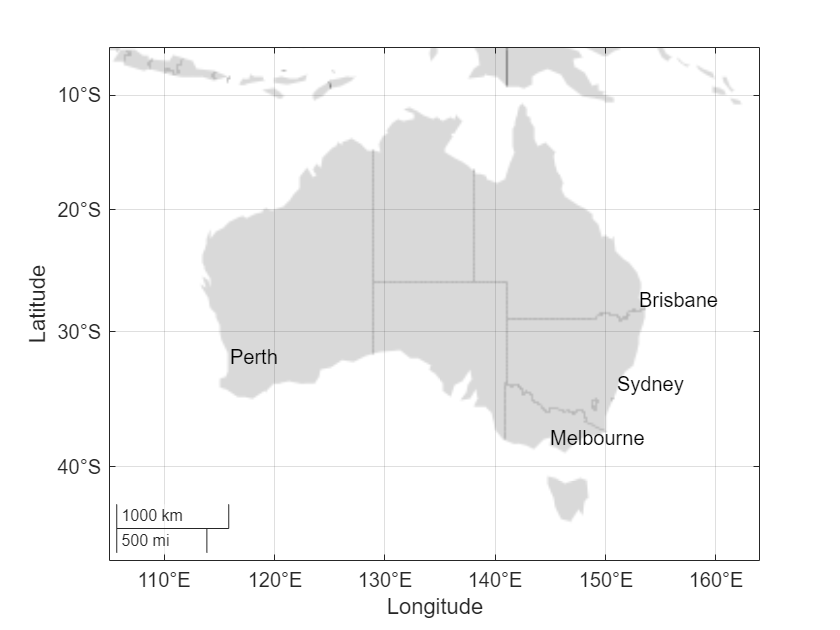
Interactively select the locations for text on a map by using geographic axes and the gtext function.
Create a new map of Australia that uses the grayland basemap.
figure
geobasemap grayland
geolimits([-46 -6],[98 170])
Label Sydney, Melbourne, Brisbane, and Perth by displaying text on the map.
To interactively select the locations, specify
interactivelySelectLocationsastrue. Specify the text as input to thegtextfunction.To use predefined points, specify
interactivelySelectLocationsasfalse.
txt = ["Sydney"; "Melbourne"; "Brisbane"; "Perth"]; interactivelySelectLocations =false; if interactivelySelectLocations gtext(txt) else lat = [-34 -38 -27.5 -32]; lon = [151 145 153 116]; text(lat,lon,txt) end
See Also
Functions
geolimits|geobasemap|ginput|gtext