Erstellen eines Liniendiagramms mit Markern
Einem Liniendiagramm Marker hinzuzufügen, kann hilfreich sein, um mehrere Linien voneinander zu unterscheiden oder bestimmte Datenpunkte hervorzuheben. Sie können eine der folgenden Methoden zum Hinzufügen von Markern nutzen:
Fügen Sie dem Eingabeargument zur Angabe einer Linie ein Markersymbol wie
plot(x,y,'-s')hinzu.Legen Sie die Eigenschaft
Markerals Name-Wert-Paar wieplot(x,y,'Marker','s')fest.
Eine Liste der Marker-Optionen finden Sie unter Unterstützte Markersymbole.
Hinzufügen von Markern zu einem Liniendiagramm
Erstellen Sie ein Liniendiagramm. Zeigen Sie bei jedem Datenpunkt einen Marker an, indem Sie beim Aufrufen der plot-Funktion das Eingabeargument zur Linienangabe verwenden. Verwenden Sie beispielsweise '-o', um eine durchgezogene Linie mit kreisförmigen Markern zu erstellen.
x = linspace(0,10,100);
y = exp(x/10).*sin(4*x);
plot(x,y,'-o')
Wenn Sie ein Markersymbol, aber keinen Linienstil festlegen, zeigt plot nur die Marker ohne Verbindungslinie an.
plot(x,y,'o')
Alternativ können Sie einer Linie Marker hinzufügen, indem Sie die Eigenschaft Marker als Name-Wert-Paar festlegen. Mittels plot(x,y,'Marker','o') wird beispielsweise eine Linie mit kreisförmigen Markern erstellt.
Festlegen von Markergröße und -Farbe
Erstellen Sie ein Liniendiagramm mit Markern. Sie können die Marker anpassen, indem Sie diese Eigenschaften mithilfe von Name-Wert-Paar-Argumenten mit der Funktion plot festlegen:
MarkerSize- Markergröße, wird als positiver Wert festgelegt.MarkerEdgeColor- Marker-Umrissfarbe, wird als Farbname oder RGB-Tripel festgelegt.MarkerFaceColor- Marker-Füllfarbe, wird als Farbname oder RGB-Tripel festgelegt.
Sie können die Farben entweder mit einem Zeichenvektor eines Farbnamens wie 'red' oder einem RGB-Tripel wie [0.4 0.6 0.7] festlegen. Ein RGB-Tripel ist ein aus drei Elementen bestehender Zeilenvektor, dessen Elemente die Intensitäten der Rot-, Grün- und Blaukomponenten der Farbe angeben. Die Intensitäten müssen im Bereich [0,1] liegen.
x = linspace(0,10,50);
y = sin(x);
plot(x,y,'-s','MarkerSize',10,...
    'MarkerEdgeColor','red',...
    'MarkerFaceColor',[1 .6 .6])

Regeln der Position von Markern entlang einer Linie
Erstellen Sie ein Liniendiagramm mit 1 000 Datenpunkten, fügen Sie Sternchen-Marker hinzu und regeln Sie die Marker-Positionen mithilfe der Eigenschaft MarkerIndices. Setzen Sie die Eigenschaft auf die Indizes der Datenpunkte, bei denen Sie die Marker anzeigen möchten. Zeigt einen Marker alle 10 Datenpunkte an, beginnend mit dem ersten Datenpunkt.
x = linspace(0,10,1000);
y = exp(x/10).*sin(4*x);
plot(x,y,'-*','MarkerIndices',1:10:length(y))

Anzeigen von Markern bei maximalen und minimalen Datenpunkten
Erstellen Sie einen Vektor zufälliger Daten und suchen Sie den Index der Mindest- und Höchstwerte. Erstellen Sie daraufhin ein Liniendiagramm der Daten. Setzen Sie die Eigenschaft MarkerIndices auf einen Vektor der Indexwerte, um rote Marker bei den maximalen und minimalen Datenwerten anzuzeigen.
x = 1:100;
y = rand(100,1);
idxmin = find(y == max(y));
idxmax = find(y == min(y));
plot(x,y,'-p','MarkerIndices',[idxmin idxmax],...
    'MarkerFaceColor','red',...
    'MarkerSize',15)

Rücksetzen auf Standard-Markerpositionen
Modifizieren Sie die Markerpositionen und setzen Sie sie daraufhin auf die Standardpositonen zurück.
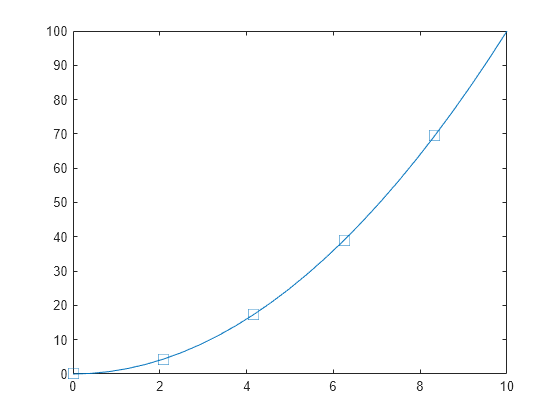
Erstellen Sie ein Liniendiagramm und zeigen Sie jeden fünften Datenpunkt als großen quadratischen Marker an. Weisen Sie der Variable p das Diagramm-Linienobjekt zu, um nach der Erstellung auf dessen Eigenschaften zugreifen zu können.
x = linspace(0,10,25);
y = x.^2;
p = plot(x,y,'-s');
p.MarkerSize = 10;
p.MarkerIndices = 1:5:length(y);
Setzen Sie die Eigenschaft MarkerIndices auf den Standardwert zurück; dies ist ein Vektor aller Indexwerte von 1 bis hin zur Anzahl der Datenpunkte.
p.MarkerIndices = 1:length(y);

Unterstützte Markersymbole
| Markierung | Beschreibung | Resultierende Markierung |
|---|---|---|
"o" | Kreis |
|
"+" | Pluszeichen |
|
"*" | Sternchen |
|
"." | Punkt |
|
"x" | Kreuz |
|
"_" | Horizontale Linie |
|
"|" | Vertikale Linie |
|
"square" | Quadrat |
|
"diamond" | Raute |
|
"^" | Aufwärts zeigendes Dreieck |
|
"v" | Abwärts zeigendes Dreieck |
|
">" | Nach rechts zeigendes Dreieck |
|
"<" | Nach links zeigendes Dreieck |
|
"pentagram" | Pentagramm |
|
"hexagram" | Hexagramm |
|
"none" | Keine Markierungen | Nicht zutreffend |
Das Eingabeargument für die Linien-Angabe unterstützt keine Marker-Optionen, die mehr als ein Zeichen lang sind. Verwenden Sie diese Einzeichen-Methode oder legen Sie stattdessen die Eigenschaft Marker fest.


