Plot Polar Equations in an App
You can plot a polar equation in an app using the polaraxes and polarplot functions. In this example app, when an app user changes parameter values or component properties, the polar plot updates to reflect the changes. This example demonstrates these app building tasks:
Create different types of axes programmatically to display plots that
uiaxesdoes not support.Call a plotting function within an app.
Set Up Polar Axes
You can add specialized axes to an app programmatically. This approach is useful for creating non-Cartesian plots, because the UIAxes object supports only Cartesian plots. For example, polar axes are a specialized type of axes for plotting polar coordinates. Unlike UIAxes objects, which you can add to your app interactively, you must create a PolarAxes object within a startupFcn callback function.
In your startupFcn code, create and position the polar axes within the app by parenting the axes to a panel. Store the PolarAxes object in a new private property named Pax so that you can access it in different parts of the app code. You can create a private property by selecting Property from the Editor tab of the App Designer toolstrip and choosing the Private Property option.
app.Pax = polaraxes(app.Panel);
For more information about startupFcn callbacks, see Startup Tasks and Input Arguments in App Designer.
Plot Polar Equation
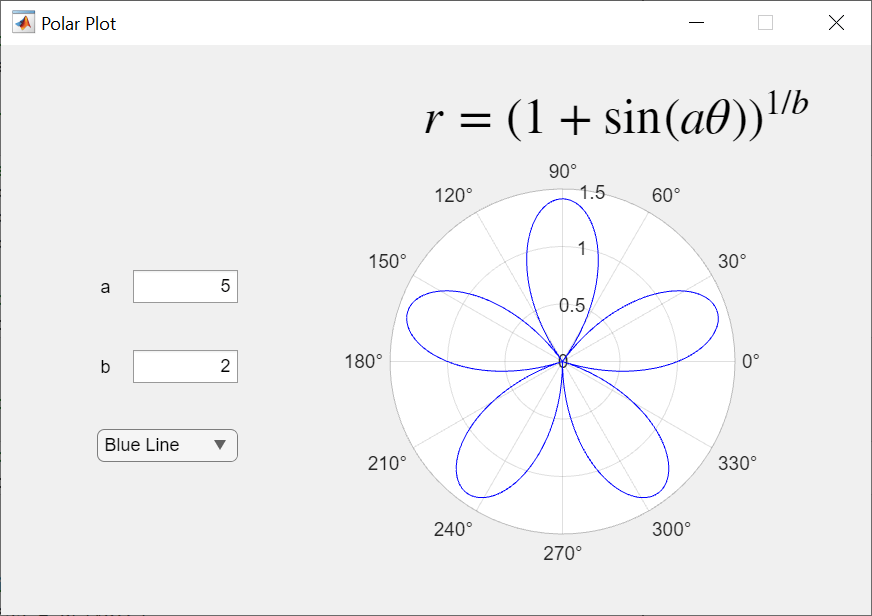
Plot a polar equation by specifying the app.Pax property you created as the first input to the polarplot function. For example, to update the plot when an app user changes parameter values, create a ValueChangedFcn callback function for the a and b edit fields. Then add the plotting command within this callback.
theta = 0:pi/1800:2*pi;
r = (1 + sin(a.*theta)).^(1/b);
plotline = polarplot(app.Pax,theta,r);