obliqueslice
Extract oblique slice from 3-D volumetric data
Syntax
Description
B = obliqueslice(V,point,normal)V. The slice is
extracted with reference to a given point on the volume and a normal vector. The slicing
plane is perpendicular to the normal vector and passes through the specified point.
For information about how the slice is extracted with respect to the given point and the normal, see Oblique Slicing.
Examples
Load a 3-D volumetric data set into the workspace.
load mriRemove singleton dimensions by using the squeeze function.
V = squeeze(D);
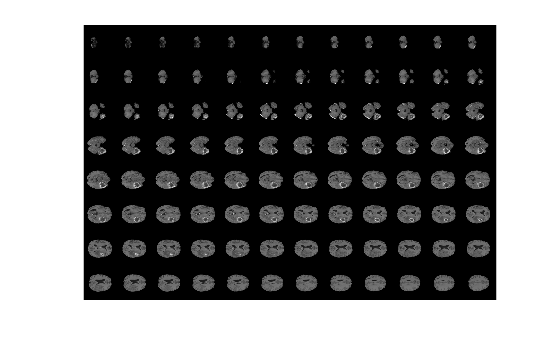
Display horizontal slices of the data by using the montage function.
montage(V,map,'Size',[3 9]);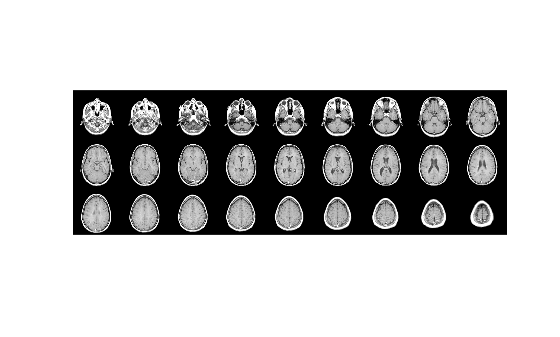
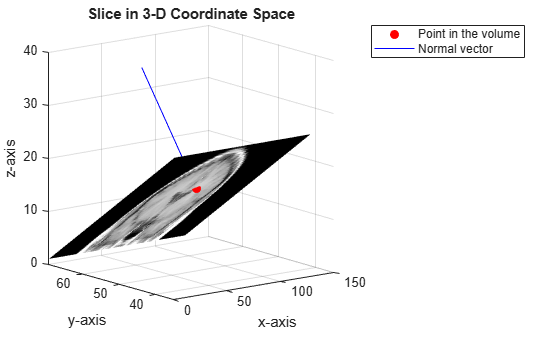
Specify a point in the volume for the slice to pass through.
point = [73 50 15.5];
Specify a normal vector in 3-D coordinate space.
normal = [0 15 20];
Extract a slice from the volumetric data. The slice is perpendicular to the normal vector and passes through the specified point.
[B,x,y,z] = obliqueslice(V,point,normal);
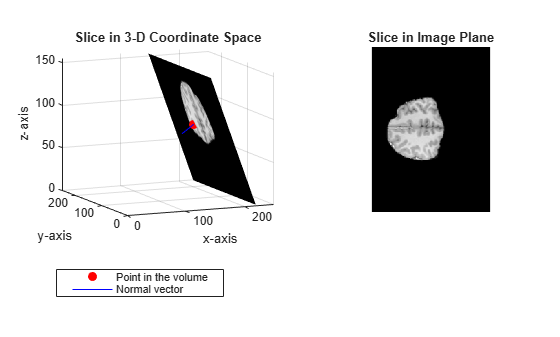
Display the extracted slice in the 3-D coordinate space.
figure
surf(x,y,z,B,'EdgeColor','None','HandleVisibility','off');
grid on
view([-38 12])
colormap(gray)
xlabel('x-axis')
ylabel('y-axis');
zlabel('z-axis');
title('Slice in 3-D Coordinate Space')
Plot the point and the normal vector.
hold on
plot3(point(1),point(2),point(3),'or','MarkerFaceColor','r');
plot3(point(1)+[0 normal(1)],point(2)+[0 normal(2)],point(3)+[0 normal(3)], ...
    '-b','MarkerFaceColor','b');
hold off
legend('Point in the volume','Normal vector')
Display the extracted slice in the image plane.
figure
imshow(B,[])
title('Slice in Image Plane')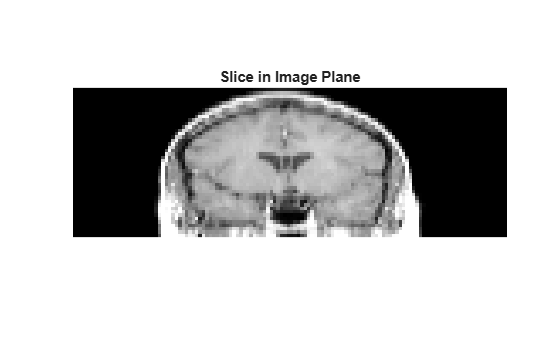
Load a 3-D volumetric data set into the workspace.
s = load(fullfile(toolboxdir('images'),'imdata','BrainMRILabeled','images','vol_001.mat'));
V = s.vol;
Display horizontal slices of the data by using the montage function.
montage(V,'Indices',12:118,'Size',[8 12],'DisplayRange',[]);
Specify the normal vector to a plane in 3-D coordinate space.
normal = [20 0 10];
Extract multiple slices along the direction of the normal vector using a for loop. In each iteration:
Specify a point that the slice has to pass through.
Extract the slice, specifying the output size to
'Full'and the fill value for padding pixels as 255. The extracted slices are perpendicular to the normal vector and pass through the specified point.Display the extracted slices.
sliceIdx = 10:5:180;

figure
for s = 1:length(sliceIdx)

    pt = [sliceIdx(s) 150 80];
    [B,x,y,z] = obliqueslice(V,pt,normal,'OutputSize','Full','FillValues',255);

    Bslices(:,:,s) = B;

    % Display the slice in 3-D coordinate space
    subplot('Position',[0.11 0.36 0.38 0.5])
    surf(x,y,z,B,'EdgeColor','None','HandleVisibility','off');
    grid on
    view([-24 12])
    colormap(gray)
    xlabel('x-axis')
    ylabel('y-axis');
    zlabel('z-axis');
    zlim([0 155]);
    ylim([0 250]);
    xlim([0 250]);
    title('Slice in 3-D Coordinate Space')
    % Plot the point and the normal vector.
    hold on
    plot3(pt(1),pt(2),pt(3),'or','MarkerFaceColor','r')
    plot3( ...
        pt(1)+[-normal(1) normal(1)], ...
        pt(2)+[-normal(2) normal(2)], ...
        pt(3)+[-normal(3) normal(3)], ...
        '-b','MarkerFaceColor','b')
    legend('Point in the volume','Normal vector','Position',[0.1 0.12 0.3 0.08])
    hold off
    % Display the extracted slice.
    subplot('Position',[0.6 0.37 0.34 0.49])
    imshow(B,[])
    title('Slice in Image Plane')
    pause(0.5);
end
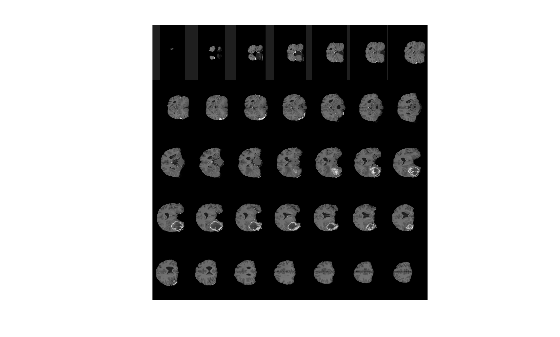
Display the extracted image slices by using the montage function.
figure
montage(Bslices,'Size',[5 7],'DisplayRange',[]);
Input Arguments
Name-Value Arguments
Output Arguments
More About
Given a point (px,
py,
pz) and the normal vector (a, b,
c), the obliqueslice function solves the plane equation a(x-px)+b(y-py)+c(z-pz)
= 0
The point (px, py, pz) lies in the volumetric data. The slicing plane is perpendicular to the normal vector and passes through the given point.
The order in which the coordinates of the extracted slice in 3-D space is mapped to a 2-D plane depends on its inclination angle with respect to the horizontal and vertical planes.
The obliqueslice function returns the output
matrices x, y, and z that
contain the x, y, z coordinates of
the points in 3-D coordinate space that form the image slice. The
obliqueslice function interpolates the intensity values at these
points and maps it to the 2-D plane. The first value in the output matrices x(1,1), y(1,1),
z(1,1) specify 3-D coordinate of a point that maps as the upper-left pixel, (1,
1) in the image plane. Starting from this point, the 3-D coordinates that constitute the
image slice along with the associated intensity values are read in left-to-right,
top-to-bottom scan order. These intensity values fill the 2-D image plane in the same
left-to-right, top-to-bottom scan order.
Suppose V is the input volumetric data and B is the output 2-D image, then B(i,j) = V(a,b,c).
Where, a = x(i,j), b = y(i,j), and c = z(i,j).