How to Plot Data in the App
How to Plot Data in the App
After importing data into the System Identification app, as described in Represent Data, you can plot the data.
To create one or more plots, select the corresponding check box in the Data Views area of the System Identification app.
An active data icon has a thick line in the icon, while an inactive data set has a thin line. Only active data sets appear on the selected plots. To toggle including and excluding data on a plot, click the corresponding icon in the System Identification app. Clicking the data icon updates any plots that are currently open.
When you have several data sets, you can view different input-output channel pair by selecting that pair from the Channel menu. For more information about selecting different input and output pairs, see Selecting Measured and Noise Channels in Plots.
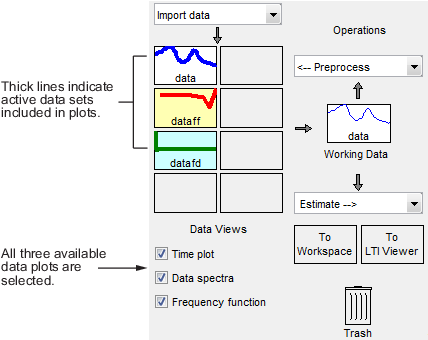
In this example, data and dataff are active and
appear on the three selected plots.
To close a plot, clear the corresponding check box in the System Identification app.
Tip
To get information about working with a specific plot, select a help topic from the Help menu in the plot window.
The plots you create using the System Identification app provide options that are specific to the System Identification Toolbox™ product, such as selecting specific channel pairs in a multivariate signals or converting frequency units between Hertz and radians per second.
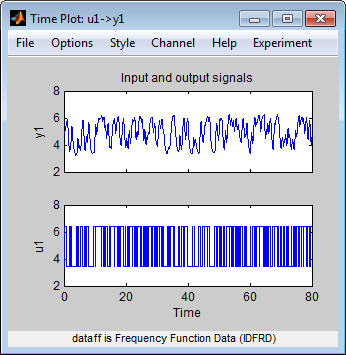
Manipulating a Time Plot
The Time plot only shows time-domain data. In this example,
data1 is displayed on the time plot because, of the three data sets, it
is the only one that contains time-domain input and output.
Time Plot of data1
The following table summarizes options that are specific to time plots, which you can select from the plot window menus. For general information about working with System Identification Toolbox plots, see Working with Plots.
Time Plot Options
| Action | Command |
|---|---|
|
Toggle input display between piece-wise continuous (zero-order hold) and linear interpolation (first-order hold) between samples. Note This option only affects the display and not the intersample behavior specified when importing the data. | Select Style > Staircase input for zero-order hold or Style > Regular input for first-order hold. |
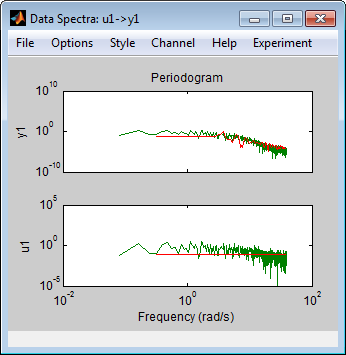
Manipulating Data Spectra Plot
The Data spectra plot shows a periodogram or a spectral estimate of
data1 and data3fd.
The periodogram is computed by taking the absolute squares of the Fourier transforms of
the data, dividing by the number of data points, and multiplying by the sample time. The
spectral estimate for time-domain data is a smoothed spectrum calculated using spa. For frequency-domain data, the Data spectra plot
shows the square of the absolute value of the actual data, normalized by the sample
time.
The top axes show the input and the bottom axes show the output. The vertical axis of each plot is labeled with the corresponding channel name.
Periodograms of data1 and data3fd
Data Spectra Plot Options
| Action | Command |
|---|---|
|
Toggle display between periodogram and spectral estimate. | Select Options > Periodogram or Options > Spectral analysis. |
|
Change frequency units. | Select Style > Frequency (rad/s) or Style > Frequency (Hz). |
|
Toggle frequency scale between linear and logarithmic. | Select Style > Linear frequency scale or Style > Log frequency scale. |
|
Toggle amplitude scale between linear and logarithmic. | Select Style > Linear amplitude scale or Style > Log amplitude scale. |
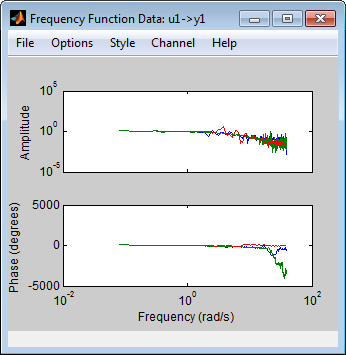
Manipulating a Frequency Function Plot
For time-domain data, the Frequency function plot shows the
empirical transfer function estimate (etfe). For frequency-domain data, the plot shows the ratio of output to input
data.
The frequency-response plot shows the amplitude and phase plots of the corresponding frequency response. For more information about frequency-response data, see Frequency-Response Data Representation.
Frequency Functions of data1 and data3fd
Frequency Function Plot Options
| Action | Command |
|---|---|
|
Change frequency units. | Select Style > Frequency (rad/s) or Style > Frequency (Hz). |
|
Toggle frequency scale between linear and logarithmic. | Select Style > Linear frequency scale or Style > Log frequency scale. |
|
Toggle amplitude scale between linear and logarithmic. | Select Style > Linear amplitude scale or Style > Log amplitude scale. |