Plot Time Series Data Using Econometric Modeler App
These examples show how to plot univariate and multivariate time series data by using the Econometric Modeler app. After plotting time series, you can interact with the plots.
Plot Univariate Time Series Data
This example shows how to plot univariate time series data. The data set contains the quarterly US gross domestic product (GDP) prices from 1947 through 2005.
At the command line, load the Data_GDP.mat data set.
load Data_GDP
DataTimeTable is a timetable containing time series data.
At the command line, open the Econometric Modeler app.
econometricModeler
Alternatively, open the app from the apps gallery (see Econometric Modeler).
Import DataTimeTable into the app:
On the Modeler tab, in the Import section, click the Import button
 .
.In the Import Data dialog box, select the check box for the
DataTimeTablevariable.Click Import.
The variable GDP appears in the Time
Series pane, and its time series plot appears in the
Plot(GDP) figure window. The plot contains a grid
and demarcates periods when the US was experiencing a recession with gray
bands. You can toggle the grid by expanding the Axes toolbar and clicking
Grid. You can toggle the recession bands by
right-clicking the plot and checking the Show
Recessions box or by expanding the Axes toolbar and
clicking Recessions.
Focus on the GDP from 1970 to the end of the sampling period:
Pause on the plot, then click
 .
.Position the cross hair at (1970,12000), then drag the cross hair to (2005,3500).
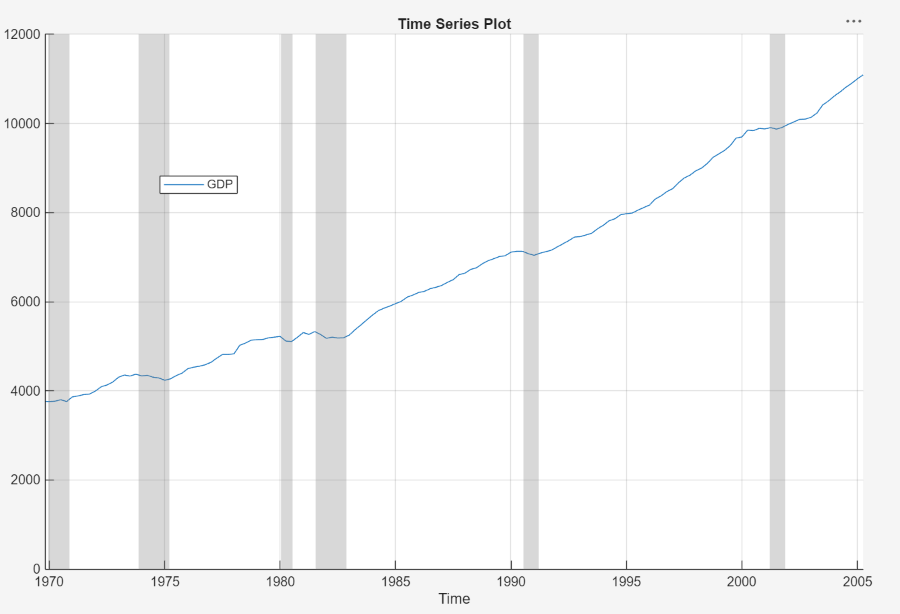
The GDP appears flat or decreasing before and during periods of recession.
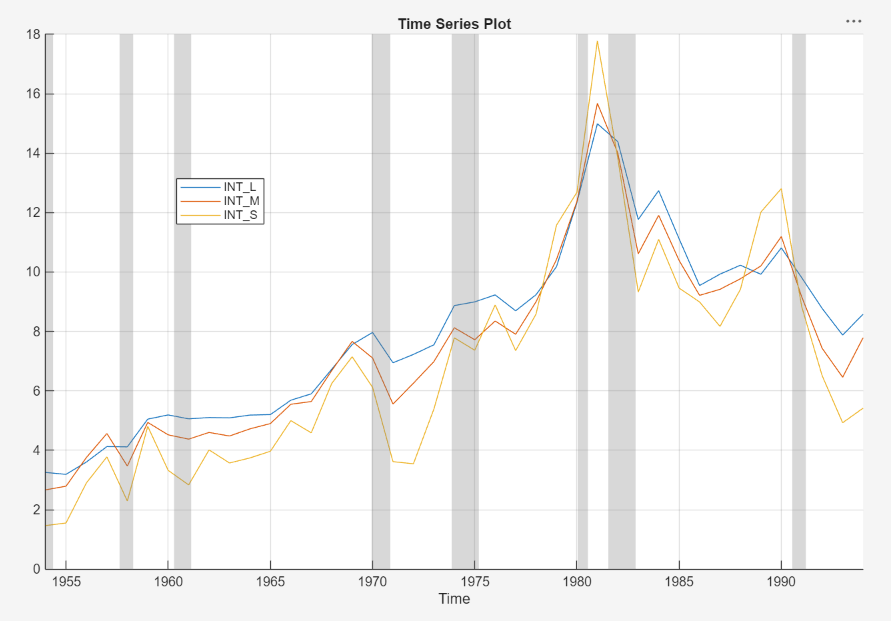
Plot Multivariate Time Series and Correlations
This example shows how to plot multiple series on the same
time series plot, interact with the resulting plot, and plot the correlations
among the variables. The data set, stored in Data_Canada,
contains annual Canadian inflation and interest rates from 1954 through
1994.
At the command line, load the Data_Canada.mat data
set.
load Data_CanadaAt the command line, open the Econometric Modeler app.
econometricModeler
Alternatively, open the app from the apps gallery (see Econometric Modeler).
Import DataTimeTable into the app:
On the Modeler tab, in the Import section, click the Import button
.In the Import Data dialog box, select the check box for the
DataTimeTablevariable.Click Import.
The Canadian interest and inflation rate variables appear in the Time Series pane, and a time series plot containing all the series appears in the Plot(INF_C) figure window.
Remove the inflation rates (INF_C and
INF_G) from the time series plot:
Right-click the plot.
Point to Show Time Series, then clear INF_C.
Repeat steps 1 and 2, but clear INF_G instead.
Generate a correlation plot for all variables:
Select all variables in the Time Series pane.
Click the Plots tab, then click Corr.
A correlations plot appears in the Corr(INF_C) figure window.
Remove the inflation rate based on GDP (INF_G)
from the correlations plot:
Right-click the plot.
Point to Show Time Series, and then clear INF_G.
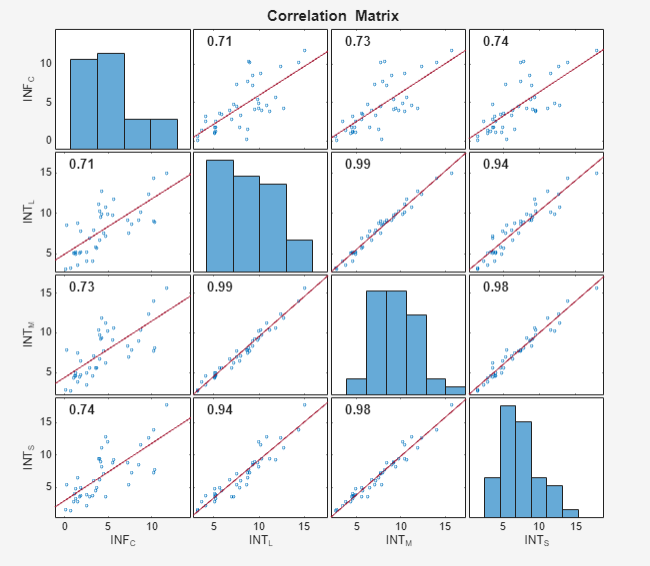
All variables appear to be skewed to the right. According to the Pearson correlation coefficients (top-left of the off-diagonal plots):
The inflation rate explains at least 70% of the variability in the interest rates (when used as a predictor in a linear regression).
The interest rates are highly correlated; each explains at least 94% of the variability in another series.
See Also
Apps
Functions
Topics
- Analyze Time Series Data Using Econometric Modeler
- Prepare Time Series Data for Econometric Modeler App
- Import Time Series Data into Econometric Modeler App
- Detect Serial Correlation Using Econometric Modeler App
- Transform Time Series Using Econometric Modeler App
- Creating ARIMA Models Using Econometric Modeler App