parkingLaneMarkingVertices
Syntax
Description
[
returns the parking lane marking vertices plmv,plmf] = parkingLaneMarkingVertices(scenario)plmv and parking lane marking
faces plmf contained in driving scenario scenario.
The plmf and plmv outputs are in the world
coordinates of scenario. Use parking lane marking vertices and faces to
display lane markings using the laneMarkingPlotter function with a bird's-eye plot.
Examples
Generate detections of cars parked in a parking lot, and plot the detections on a bird's-eye plot.
Create a driving scenario containing a road and parking lot.
scenario = drivingScenario;
roadcenters = [10 40; 10 -40];
road(scenario,roadcenters);
vertices = [0 20; 20 20; 20 -20; 0 -20];
parkingLot(scenario,vertices,ParkingSpace=parkingSpace);
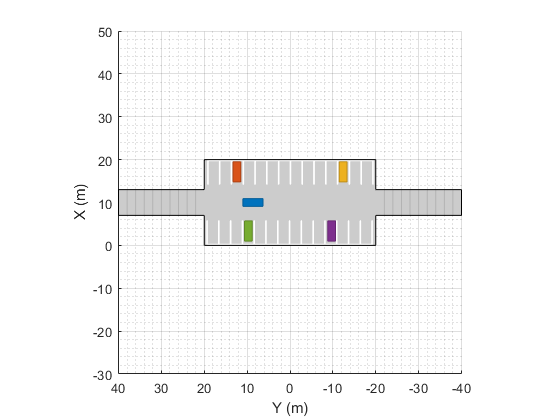
Add an ego vehicle and specify a trajectory in which the vehicle drives through the parking lot.
ego = vehicle(scenario);
waypoints = [10 35 0; 10 10 0];
speed = 5; % m/s
smoothTrajectory(ego,waypoints,speed)
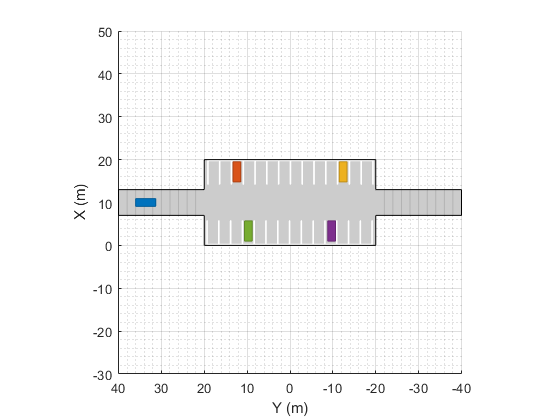
Create parked cars in several parking spaces. Plot the scenario.
parkedCar1 = vehicle(scenario,Position=[15.8 12.4 0]);
parkedCar2 = vehicle(scenario,Position=[15.8 -12.4 0]);
parkedCar3 = vehicle(scenario,Position=[2 -9.7 0]);
parkedCar4 = vehicle(scenario,Position=[2 9.7 0]);
plot(scenario)
Create a vision sensor for generating the detections. By default, the sensor is mounted to the front bumper of the ego vehicle.
sensor = visionDetectionGenerator;
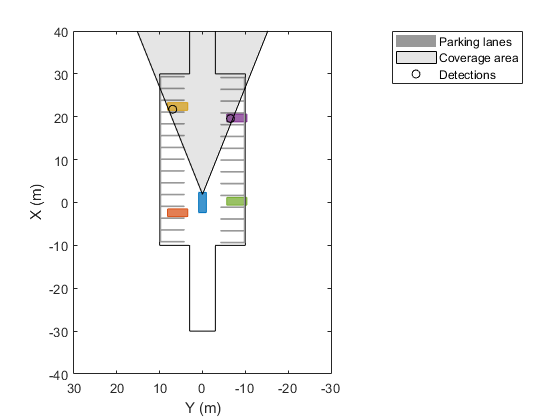
Create a bird's-eye plot and plotters for visualizing the target outlines, road boundaries, parking lane markings, sensor coverage area, and detections. Then, simulate the scenario and generate the detections.
bep = birdsEyePlot(XLim=[-40 40],YLim=[-30 30]);
olPlotter = outlinePlotter(bep);
lbPlotter = laneBoundaryPlotter(bep);
lmPlotter = laneMarkingPlotter(bep,DisplayName="Parking lanes");
caPlotter = coverageAreaPlotter(bep,DisplayName="Coverage area");
detPlotter = detectionPlotter(bep,DisplayName="Detections");

while advance(scenario)

    % Plot target outlines.
    [position,yaw,length,width,originOffset,color] = targetOutlines(ego);
    plotOutline(olPlotter,position,yaw,length,width)

    % Plot lane boundaries of ego vehicle.
    rbEgo = roadBoundaries(ego);
    plotLaneBoundary(lbPlotter,rbEgo)

    % Plot parking lane markings.
    [plmv,plmf] = parkingLaneMarkingVertices(ego);
    plotParkingLaneMarking(lmPlotter,plmv,plmf)

    % Plot sensor coverage area.
    mountPosition = sensor.SensorLocation;
    range = sensor.MaxRange;
    orientation = sensor.Yaw;
    fieldOfView = sensor.FieldOfView(1);
    plotCoverageArea(caPlotter,mountPosition,range,orientation,fieldOfView)

    % Generate and plot detections.
    actors = targetPoses(ego);
    time = scenario.SimulationTime;
    [dets,isValidTime] = sensor(actors,time);
    if isValidTime
        positions = cell2mat(cellfun(@(x)([x.Measurement(1) x.Measurement(2)]), ...
            dets,UniformOutput=false));
        plotDetection(detPlotter,positions)
    end

end
Input Arguments
Output Arguments
Algorithms
This function uses the patch function to define lane marking vertices
and faces.
Version History
Introduced in R2021b