plotroc
(Zu entfernen) Darstellen der Empfänger-Betriebseigenschaften (Receiver Operating Characteristic, ROC)
plotroc wird in einer zukünftigen Version entfernt. Weitere Informationen finden Sie unter Transition Legacy Neural Network Code to dlnetwork Workflows.
Ratschläge zur Aktualisierung Ihres Codes finden Sie unter Versionsverlauf.
Beschreibung
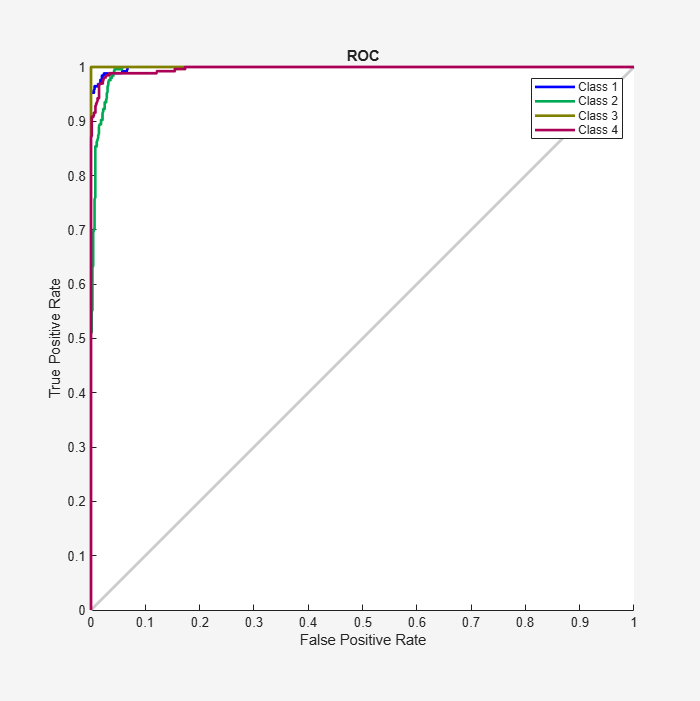
plotroc( stellt die Empfänger-Betriebseigenschaften für jede Ausgabeklasse dar. Je näher die Kurve am linken und oberen Rand des Diagramms liegt, desto besser die Klassifizierung.targets,outputs)
Tipp
plotroc unterstützt keine kategorischen Ziele. Verwenden Sie rocmetrics, um ROC-Metriken für kategorische Ziele darzustellen.
plotroc(targets1,outputs2,'name1',...) generiert mehrere Diagramme.
Beispiele
Dieses Beispiel zeigt, wie sich die Empfänger-Betriebseigenschaften für jede Ausgabeklasse in einem Muster-Netz darstellen lassen.
load simplecluster_dataset
net = patternnet(20);
net = train(net,simpleclusterInputs,simpleclusterTargets);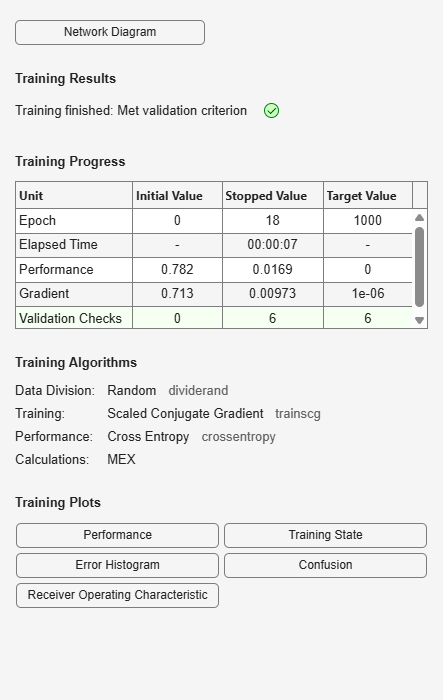
simpleclusterOutputs = sim(net,simpleclusterInputs);
plotroc(simpleclusterTargets,simpleclusterOutputs)
Eingabeargumente
Versionsverlauf
Eingeführt in R2008aSiehe auch
Time Series Modeler | fitrnet (Statistics and Machine Learning Toolbox) | fitcnet (Statistics and Machine Learning Toolbox) | trainnet | trainingOptions | dlnetwork