Convert Time Delay in Discrete-Time Model to Factors of 1/z
This example shows how to convert a time delay in a discrete-time model to factors of 1/_z_.
In a discrete-time model, a time delay of one sampling interval is equivalent to a factor of 1/_z_ (a pole at z = 0) in the model. Therefore, time delays stored in the InputDelay, OutputDelay, or IODelay properties of a discrete-time model can be rewritten in the model dynamics by rewriting them as poles at z = 0. However, the additional poles increase the order of the system. Particularly for large time delays, this can yield systems of very high order, leading to long computation times or numerical inaccuracies.
To illustrate how to eliminate time delays in a discrete-time closed-loop model, and to observe the effects of doing so, create the following closed-loop system:
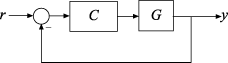
G is a first-order discrete-time system with an input delay, and C is a PI controller.
G = ss(0.9,0.125,0.08,0,'Ts',0.01,'InputDelay',7);
C = pid(6,90,0,0,'Ts',0.01);
T = feedback(C*G,1);
Closing the feedback loop on a plant with input delays gives rise to internal delays in the closed-loop system. Examine the order and internal delay of T.
order(T)
ans =
2
T.InternalDelay
ans =
7
T is a second-order state-space model. One state is contributed by the first-order plant, and the other by the one pole of the PI controller. The delays do not increase the order of T. Instead, they are represented as an internal delay of seven time steps.
Replace the internal delay by .
Tnd = absorbDelay(T);
This command converts the internal delay to seven poles at z = 0. To confirm this, examine the order and internal delay of Tnd.
order(Tnd)
ans =
9
Tnd.InternalDelay
ans =

  0×1 empty double column vector
Tnd has no internal delay, but it is a ninth-order model, due to the seven extra poles introduced by absorbing the seven-unit delay into the model dynamics.
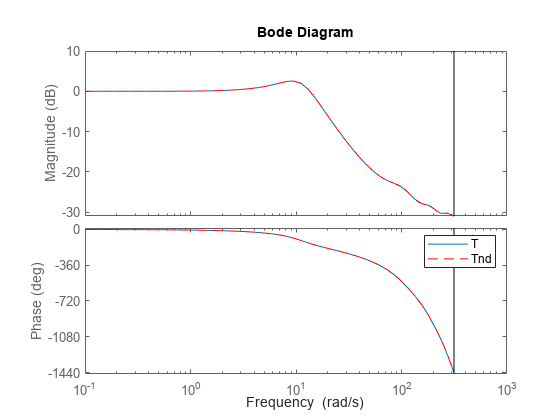
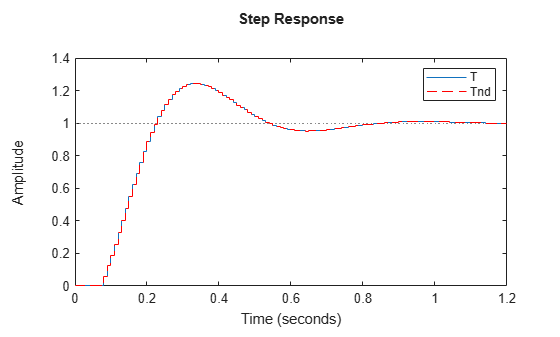
Despite this difference in representation, the responses of Tnd exactly match those of T.
stepplot(T,Tnd,'r--')
legend('T','Tnd');
bodeplot(T,Tnd,'r--')
legend('T','Tnd');