Constellation Diagram
Display and analyze input signals in IQ-plane
Libraries:
Communications Toolbox /
Comm Sinks
Communications Toolbox HDL Support /
Comm Sinks
Description
The Constellation Diagram block displays real- and complex-valued floating- and fixed-point signals in the IQ plane. Use this block to perform qualitative and quantitative analysis on modulated single-carrier signals. Specifically, the IQ-plane displays the in-phase and quadrature components of modulated signals on the real and imaginary axis of an xy-plot.

In the Constellation Diagram window, you can:
Input and plot multiple signals on a single constellation diagram. To define a reference constellation for each input signal, use the Reference Constellation parameter.
Select signals in the legend to toggle visibility of individual channels. To display the legend, use the Legend parameter on the Scope tab. For a multichannel signal, specify the input as a matrix with individual signals defined in the columns of the matrix.
Display calculated error vector magnitude (EVM) and modulation error ratio (MER) measurements for individual signals. To view and configure the measurements, select EVM/MER on the Measurements tab. When multiple signals are input, you can select which signal to use for measurements in the Channel section.
Examples
Use the Constellation Diagram block to visualize the constellation of a modulated signal.
A random signal is M-PSK modulated, filtered through an AWGN channel, and passed into a Constellation Diagram to be plotted.
Run the slex_constellation_diagram model and observe the 8-PSK constellation. The received data points are shown in yellow while the red ‘+’ symbols represent the ideal constellation locations.

After running the simulation the constellation diagram shows the noisy constellation points.

You can select the Show Signal Trajectory button to display the signal trajectory of the modulated signal.

Apply QPSK modulation to a signal of random data. Pass the modulated signal through an additive white Gaussian noise (AWGN) channel. Plot the signal constellation.
The doc_qpsk_mod model generates QPSK data, applies the AWGN, and displays the resulting constellation diagram.
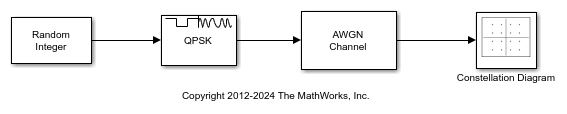
Run the model with the Eb/N0 of the AWGN Channel block set to 15 dB. The constellation diagram shows the QPSK symbol samples with AWGN.
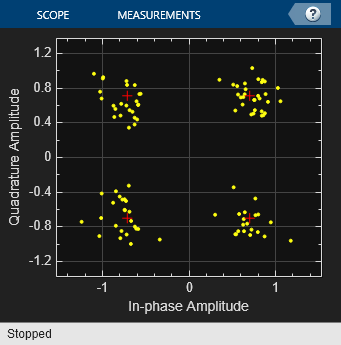
Change the Eb/N0 from 15 dB to 10 dB. The noise level increases as shown by the greater distance between the samples in the constellation diagram.

This example shows how to use the Constellation Diagram block to visualize the constellation of multi-input and multichannel modulated signals.
Pass two random 16-QAM signals through the first input port and a random 8-PSK signal through the second input port. One reference constellation can be defined for each input port. Since a single reference constellation is applied for all multichannel signals through one input port, use the Vector Concatenate (Simulink) block to concatenate multiple signals of the same data type and same reference constellation. In the case where all input signals are single channel input, then they can be directly fed in the Constellation Diagram.
Pass three signals through the AWGN channel and display them in a constellation diagram.
Run Example Model to Explore Its Constellation

After running the simulation, the constellation diagram shows the noisy constellation points for the input signals. The received data points shown in yellow and blue represent the two 16-QAM input signals, and the received data points shown in red represent the 8-PSK signal. The red ‘+’ symbols represent the ideal constellation locations for 16-QAM modulated signals, and the white ‘+’ symbols represent the ideal constellation locations for 8-PSK modulated signal.

The trajectory trace is shown for each signal below.

Further Exploration
Use the Trace Selection pane to display measurements for the channel of interest.
Consider modifying the model to change the current modulation order.
Extended Examples

Impact of RF Effects on Communication System Performance
Model thermal noise, phase noise, and nonlinearity impairments of an RF transceiver in Simulink®.
Ports
Input
Parameters
Block Characteristics
Data Types |
|
Direct Feedthrough |
|
Multidimensional Signals |
|
Variable-Size Signals |
|
Zero-Crossing Detection |
|