mspeaks
Convert raw peak data to peak list (centroided data)
Syntax
Description
Peaklist = mspeaks(X,Intensities)Peaklist, a two-column matrix, containing the separation-axis
value and intensity for each peak.
[
also returns Peaklist,PFWHH] = mspeaks(X,Intensities)PFWHH, a two-column matrix indicating the left and
right locations of the full width at half height (FWHH) markers for each peak. For
any peak not resolved at FWHH, mspeaks returns the peak shape
extents instead. When Intensities includes multiple signals, then
PFWHH is a cell array of matrices.
[
also returns Peaklist,PFWHH,PExt] = mspeaks(X,Intensities)PExt, a two-column matrix indicating the left and
right locations of the peak shape extents determined after wavelet denoising. When
Intensities includes multiple signals, then
PExt is a cell array of matrices.
___ = mspeaks(,
for any output variables, modifies the behavior of X,Intensities,Name,Value)mspeaks
using one or more Name=Value arguments. For example, obtain a
plot of the original signal, smoothed signal, and calculated peaks using
mspeaks(X,Intensities,ShowPlot=true).
Examples
Load a MAT-file, included with the Bioinformatics Toolbox™ software, that contains two mass spectrometry data variables, MZ_lo_res and Y_lo_res. The first, MZ_lo_res, is a vector of m/z values for a set of spectra. The second, Y_lo_res, is a matrix of intensity values for a set of mass spectra that share the same m/z range.
load sample_lo_resAdjust the baseline of the eight spectra stored in Y_lo_res by using msbackadj.
YB = msbackadj(MZ_lo_res,Y_lo_res);
Convert the raw mass spectrometry data to a peak list by finding the relevant peaks in each spectrum.
Peaklist = mspeaks(MZ_lo_res,YB);
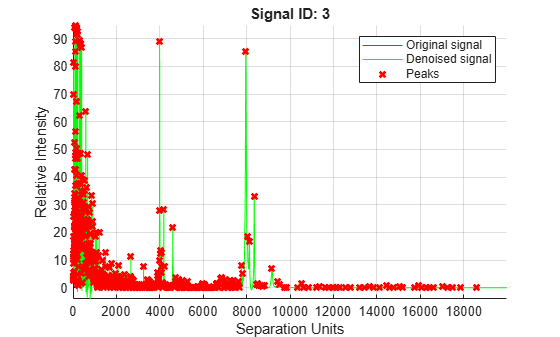
Plot the third spectrum in YB, the matrix of baseline-corrected intensity values, with the detected peaks marked.
Peaklist = mspeaks(MZ_lo_res,YB,ShowPlot=3);
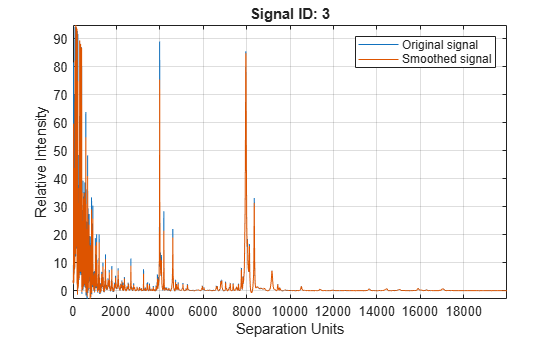
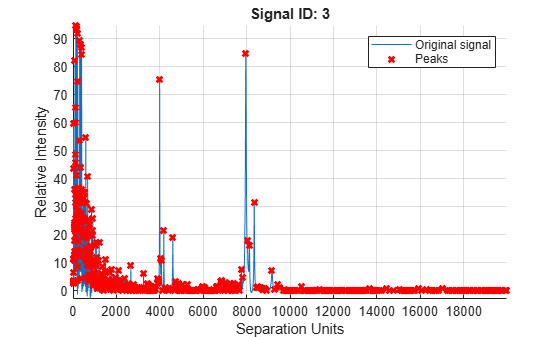
Smooth the signal using the mslowess function. Then convert the smoothed data to a peak list by finding relevant peaks and plot the third spectrum.
YS = mslowess(MZ_lo_res,YB,ShowPlot=3);
Peaklist = mspeaks(MZ_lo_res,YS,Denoising=false,ShowPlot=3);
Find the number of peaks in Peaklist.
numPeaks = numel(Peaklist)
numPeaks =
8
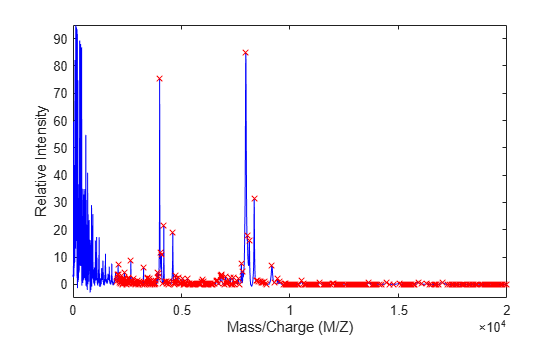
Use the cellfun function to remove all peaks with m/z values less than 2000 from the eight peaks listed in output Peaklist. Then plot the peaks of the third spectrum (in red) over its smoothed signal (in blue).
Q = cellfun(@(p) p(p(:,1)>2000,:),Peaklist,UniformOutput=false);
figure
plot(MZ_lo_res,YS(:,3),'b',Q{3}(:,1),Q{3}(:,2),'rx')
xlabel('Mass/Charge (M/Z)')
ylabel('Relative Intensity')
axis([0 20000 -5 95])
Input Arguments
Name-Value Arguments
Output Arguments
Algorithms
mspeaks converts raw peak data to a peak list (centroided data)
by:
Smoothing the signal using undecimated wavelet transform with Daubechies coefficients
Assigning peak locations
Estimating noise
Eliminating peaks that do not satisfy specified criteria
References
[1] Morris, J.S., Coombes, K.R., Koomen, J., Baggerly, K.A., and Kobayash, R. (2005) Feature extraction and quantification for mass spectrometry in biomedical applications using the mean spectrum. Bioinfomatics 21:9, 1764–1775.
[2] Yasui, Y., Pepe, M., Thompson, M.L., Adam, B.L., Wright, G.L., Qu, Y., Potter, J.D., Winget, M., Thornquist, M., and Feng, Z. (2003) A data-analytic strategy for protein biomarker discovery: profiling of high-dimensional proteomic data for cancer detection. Biostatistics 4:3, 449–463.
[3] Donoho, D.L., and Johnstone, I.M. (1995) Adapting to unknown smoothness via wavelet shrinkage. J. Am. Statist. Asso. 90, 1200–1224.
[4] Strang, G., and Nguyen, T. (1996) Wavelets and Filter Banks (Wellesley: Cambridge Press).
[5] Coombes, K.R., Tsavachidis, S., Morris, J.S., Baggerly, K.A., Hung, M.C., and Kuerer, H.M. (2005) Improved peak detection and quantification of mass spectrometry data acquired from surface-enhanced laser desorption and ionization by denoising spectra with the undecimated discrete wavelet transform. Proteomics 5(16), 4107–4117.
Version History
Introduced in R2007a
See Also
mspalign | msbackadj | msdotplot | msalign | msheatmap | mslowess | msnorm | msresample | msppresample | mssgolay | msviewer
Topics
- Mass Spectrometry and Bioanalytics
- Preprocessing Raw Mass Spectrometry Data
- Visualizing and Preprocessing Hyphenated Mass Spectrometry Data Sets for Metabolite and Protein/Peptide Profiling
- Differential Analysis of Complex Protein and Metabolite Mixtures Using Liquid Chromatography/Mass Spectrometry (LC/MS)