18 Ergebnisse

Candlestick pattern detection.
https://markdown-url-viewer.s3.eu-west-3.amazonaws.com/index.html?url=https://raw.githubusercontent.com/DanielAtKrypton/candlesticks/master/README.md

Calculates the end indices of 90 different candlestick patterns
Description Since the early days of the Japanese rice traders, candlestick charting has grown into a complex technical analysis tool based primarily on patterns. Candlestick charts are flexible

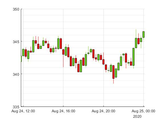
This is a simple little function that chars Japanese candlesticks
This is a little function that charts financial data using Japanese candlesticks. It takes as input highs, lows, opens, and closes, and plots the candlestick boxes, both the body part, black or
trading tool candlestick chart
candlestick_plot(high,low,opening,closing,time,varargin)Draw a chart representing market's opening, high, low, and closing price of a specific time range.Candle body represents the price range

Plots a candlestick graph.
This a candlestick graph function. It is an improvement over the one in MATLAB 5.2. It draws the colors correctly and can be included in subplots.

Candlestick chart.
Convert Intraday OHLC Values to Heikin Ashi OHLC Values
Heikin Ashi candlesticks are composed of modified OHLC values that are used in technical analysis to generate alternate candlesticks. Slight variations exist pertaining to calculation of the first
Suite of functions for accessing the Binance API via MATLAB. Supports spot and margin trading and all public endpoints.
symbol.klines - returns candlestick data for a specific symbol and interval.price - returns the latest price for a symbol or symbols.recentTrades - returns a list of recent trades for a specific
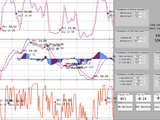
This program shows the profit and lost of using different trading strategies on Singapore stocks.
back test. Click on 'Execute' again.7. A main window opens showcasing the candlestick data of the stock and various indicators with buy and sell signals as according to the strategy implemented. Look at

Function to quantify candlesticks.
Code included will help you understand how to quantify candlestick patterns.createCandleStick.m quantifies candlestick bars to 6-digit binary codes.candleStickEvaluation.m demonstrates how you can

Parabolic SAR with candlestick chart.
Calculates Parabolic SAR very fast and creates a candlestick chart (optional).Important Note: Use at your own risk.
Short-Term Volume and Price Oscillator

This is a simple way to use the Yahoo web API in MATLAB.
struct array. Includes an optional demo that renders a candlestick chart.What this doesFetches Open, High, Low, Close, Volume for each requested symbol at a user specified interval (default is 1d).Returns

calculates Parabolic SAR given high and low
Uses technique described on the Parabolic SAR wikipedia page. Candlestick Graph package used to create picture.NOTE: I have implemented this to the best of my knowledge, but I'm noticing

Plots a bar graph of stock OHLC values, o
I needed to plot some bar charts but I haven't got the financial toolbox. I couldn't find one here so I modified Nagi Hatoum's Candlestick Graph script to display bar charts.**Update 03-30-09**I've
Internet enabled data analysis and visualization.
Constant Volume Bars
CVBars are volume dependent as opposed to time dependent candlesticks; the close of the candle occurs when some volume criteria is met, not some variable timescale (1m, 5m, etc.)This is my first

Flexible Statistics Data Analysis Toolbox
Sie können auch eine Website aus der folgenden Liste auswählen:
Amerika
- América Latina (Español)
- Canada (English)
- United States (English)
Europa
- Belgium (English)
- Denmark (English)
- Deutschland (Deutsch)
- España (Español)
- Finland (English)
- France (Français)
- Ireland (English)
- Italia (Italiano)
- Luxembourg (English)
- Netherlands (English)
- Norway (English)
- Österreich (Deutsch)
- Portugal (English)
- Sweden (English)
- Switzerland
- United Kingdom (English)
Asien-Pazifik
- Australia (English)
- India (English)
- New Zealand (English)
- 中国
- 日本Japanese (日本語)
- 한국Korean (한국어)