Hauptinhalt
7 Ergebnisse

Capturing a waveform from an Agilent oscilloscope over a standard VISA interface
Version 1.3.0.1
VinodMATLAB example to capture a waveform from an Agilent oscilloscope and grab a screenshot.
SCPIScope.m
- Example to connect to and download waveform data from an oscilloscope

This function allows a user to upload files using MATLAB to DropBox(TM).
uploadToDropbox(dropboxAccessToken,varargin)
- uploadToDropbox uses the dropboxAccessToken to upload a file to dropbox.
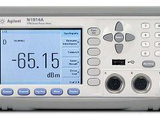
MATLAB example to make RF Power measurements using an Agilent RF Power Meter
readPowerMeter()
- This function connects to an Agilent N1914A RF power meter and measures
MATLAB application example for Agilent Infiniium and InfiniiVision oscilloscopes
genButtons(hParent, sAlpha, hFunAlpha, sBravo, hFunBravo, height)
- % GENBUTTONS Generate two MButtons in at the bottom of a figure or panel.
zeroCrossing(Data,Time)
- ZEROCROSSING Return times found for zero crossings in data with
MMenu(iParent,iTag,iLabel)
- MMENU Wrap a UIMENU
MLabel(parent,tag, strtext)
- MLabel Wrap a UICONTROL TEXT
MEditField(parent,tag, strtext)
- MEDITFIELD Wrap a UICONTROL EDIT
smPreTriggerAction
- SCOPEMATH creates a new SCOPEMATH GUI
directFeedthrough(Data,Time,varargin)
- No processing on the data - feed it back to the GUI
AnalyzedDataPanel(parent, title)
- ANALYZEDDATAPANEL creates a data analysis panel, which contains an axes,
setupScopeMath
- This function sets up the ScopeMath folder and subfolders into the MATLAB path
scopeObject(driverName, visaRsc)
- Copyright 1996-2012 The MathWorks, Inc.
MToggleButton(parent,tag, strtext)
- MTOGGLEBUTTON Wrap a UICONTROL TOGGLEBUTTON
cellmapfilt(cIn, hFunc, hFilter)
- % CELLMAPFILT Apply a function and filter to every element of a cell array.
MTriggerButton(parent,tag, strtext)
- MTRIGGERBUTTON extends from MButton. When MTriggerButton is pressed,
MLinkIcon(parent)
- MLINKICON is a pan icon
centerbuttons(hButtonAlpha, hButtonBravo)
- % CENTERBUTTONS shift two buttons right or left so that they are
lowPassFilter(Data,Time,varargin)
- LOWPASSFILTER Filter data using lowpass Chebyshev filtering
wavePSD2(Data,Time,varargin)
- WAVEPSD2 Power spectral density with zero padding
bandpassFilter(Data,Time, varargin)
- BANDPASSFILTER Filter data using bandpass Chebyshev filtering
cellmap(cIn, hFunc)
- % CELLMAP Apply a function to every element of a cell array.
MStatusBar(hParent)
- Copyright 1996-2012 The MathWorks, Inc.
histogram(Data,Time,varargin)
- HISTOGRAM Histogram plot
DataSourcePanel(parent, title)
- DATASOURCEPANEL creates a data source panel, which contains an axes,
cellapply(cIn, hFunc)
- % CELLMAP Apply a function to every element of a cell array
MTextedProgressBar(hParent)
- Copyright 1996-2012 The MathWorks, Inc.
invertWave(Data,Time)
- INVERTWAVE Invert the waveform
MPlottableAxes(iParent,iTag, iPlotTypeName, iData)
- MPLOTTABLEAXES Wrap an AXES and plot
MLabelledData(iData, iDataLabel )
- MLABELLEDDATA creates a data with label associates with it.
highPassFilter(Data,Time, varargin)
- HIGHPASSFILTER Filter data using highpass Chebyshev filtering
jitter(Data,Time)
- JITTER Calculate difference between data clock and measured clock
MToolBar(iParent)
- MTOOLBAR Wrap a UITOOLBAR
recoverPrimaryWave(Data,Time)
- RECPRIMARYWAVE Recover the primary sine wave of the waveform
wavePSD(Data,Time,varargin)
- WAVEPSD Power spectral density of the waveform
MZoomInIcon(parent)
- MZOOMINICON is a zoom in icon
MToolBarItem(parent, itemName)
- MTOOLBARITEM is abstract function for toolbar item such as 'zoom in, zoom out'ect.
MFigure(docked)
- MFIGURE Wrap a Figure with default behavior for GUIs
ScopeConfig.m
- Execute this script before running ScopeMath to initialize scope
recoverSineWaves(Data,Time,number)
- RECSINEWAVES Recover the sine waves of the waveform
shrink(hContainer)
- SHRINK Shrink the dimensions of a panel or figure to tightly contain the
MDataCursorIcon(parent)
- MDATACURSORICON is a Data cursor icon
MButton(parent,tag, strtext)
- MTBUTTON Wrap a UICONTROL PUSHBUTTON
PlotData(iXData, iYData, iZData)
- PLOTDATA creates XYZ plot data.
pulseWave2(Data,Time)
- PULSEWAVE2 Create a pulse at zero crossings
MIconFactory(p,id)
- MICONFACTORY Creates built-in toolbar components
getbasedir
- Get Base Dir helper function for finding help html files
MPanel(parent,tag)
- MPANEL Wrap a UIPANEL
MICTSource(hParent, bSimulation)
- MICTSOURCE connects to an instrument object and returns an MPanel with
MUIControl(parent,style,tag,varargin)
- MUICONTROL Wrap a UICONTROL
An example of broadcasting UDP messages from MATLAB to multiple Arduinos on the same subnet.
UDPMulticastExample.m
- An Example of UDP broadcasting from MATLAB
MATLAB® example to download arbitrary waveform data on Agilent MXG, ESG, or PSG signal sources.
Generate_Waveform_Agilent.m
- This example demonstrates generation of a custom waveform and download to

Models and literature demonstrating Model Based Design of a SUV Anti-Rollover Control System.
Sie können auch eine Website aus der folgenden Liste auswählen:
Amerika
- América Latina (Español)
- Canada (English)
- United States (English)
Europa
- Belgium (English)
- Denmark (English)
- Deutschland (Deutsch)
- España (Español)
- Finland (English)
- France (Français)
- Ireland (English)
- Italia (Italiano)
- Luxembourg (English)
- Netherlands (English)
- Norway (English)
- Österreich (Deutsch)
- Portugal (English)
- Sweden (English)
- Switzerland
- United Kingdom(English)
Asien-Pazifik
- Australia (English)
- India (English)
- New Zealand (English)
- 中国
- 日本Japanese (日本語)
- 한국Korean (한국어)