Sie verfolgen jetzt diese Einreichung
- Aktualisierungen können Sie in Ihrem Feed verfolgter Inhalte sehen.
- Je nach Ihren Kommunikationseinstellungen können Sie auch E-Mails erhalten.
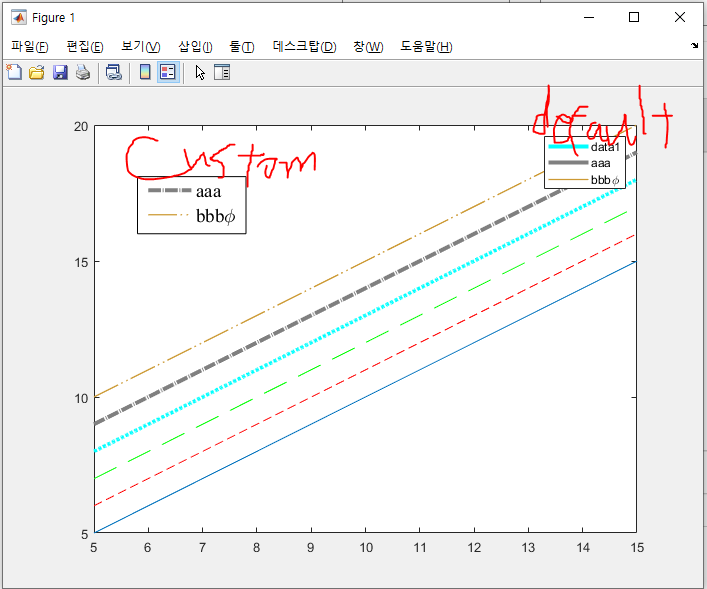
Use your custom line style with function named plot_dash
You can design your line pattern and its length by the parameter spec_ and num_
For instance,
- Matlab default dashed line ∽ spec_ = [1, 0.5], n_ = 27.1
- Matlab default solid line = spec_ = [1, 0.0], n_ = any number but 1 recommanded
- Matlab default dotted line ∽ You can do it with this code, but just use matlab default option to save your memory (50 points are created per one pattern)
- Long dashed line ∽ spec_ = [1, 0.5], n_ = 10
- Dashed dot line ∽ spec_ = [1, 0.1, 0.1, 0.1], n_ = 26
- ...
This line style is not shown for the Matlab's default legend function.
So, I provide not-sophisticated additional functions
See example codes and you'll get it.
P.S.
- Odd components of spec_ is length of solid part of the pattern
- Even components of spec_ is length of empty part of the pattern
- There's no limit for the spec_'s dimension
- However, dimension of the spec_ should be even number
- n_ is the number of patterns that can be fitted in the line x = xlim, y = [0, 0]
- Don't worry. It works based on the curve length, not the x array
Zitieren als
Seongmun Jung (2026). Custom line style for plot function (https://de.mathworks.com/matlabcentral/fileexchange/97512-custom-line-style-for-plot-function), MATLAB Central File Exchange. Abgerufen .
Allgemeine Informationen
- Version 1.0.3 (6,38 KB)
Kompatibilität der MATLAB-Version
- Kompatibel mit allen Versionen
Plattform-Kompatibilität
- Windows
- macOS
- Linux
| Version | Veröffentlicht | Versionshinweise | Action |
|---|---|---|---|
| 1.0.3 | 1. Changed functions' names
|
||
| 1.0.2 | TYPO |
||
| 1.0.1 | Correcting typo |
||
| 1.0.0 |