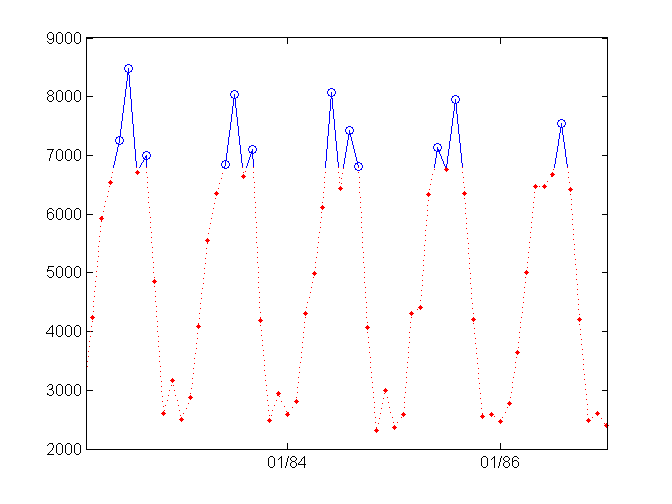
Conditionally colored line plot
Plots (2D line) graph split into two colors above and below a given threshold value

Sie verfolgen jetzt diese Einreichung
- Aktualisierungen können Sie in Ihrem Feed verfolgter Inhalte sehen.
- Je nach Ihren Kommunikationseinstellungen können Sie auch E-Mails erhalten.
Zitieren als
Matt Tearle (2026). Conditionally colored line plot (https://de.mathworks.com/matlabcentral/fileexchange/30423-conditionally-colored-line-plot), MATLAB Central File Exchange. Abgerufen .
Quellenangaben
Inspiriert: Conditionally Colored Plot (CCPLOT)
Allgemeine Informationen
- Version (3,77 KB)
Kompatibilität der MATLAB-Version
- Kompatibel mit allen Versionen
Plattform-Kompatibilität
- Windows
- macOS
- Linux
| Version | Veröffentlicht | Versionshinweise | Action |
|---|---|---|---|
| 1.1.0 | Made a quick hack to the input-parsing utility to deal with the change in precedence rules. It should now work in 19b and in previous versions. Hasn't been really thoroughly tested, though, so please report any problems. |
||
| 1.0.0 | Updated license |
||
| 1.0.0-0 |

