groupedSpacedBoxchart
Boxcharts with space between groups (MATLAB function).
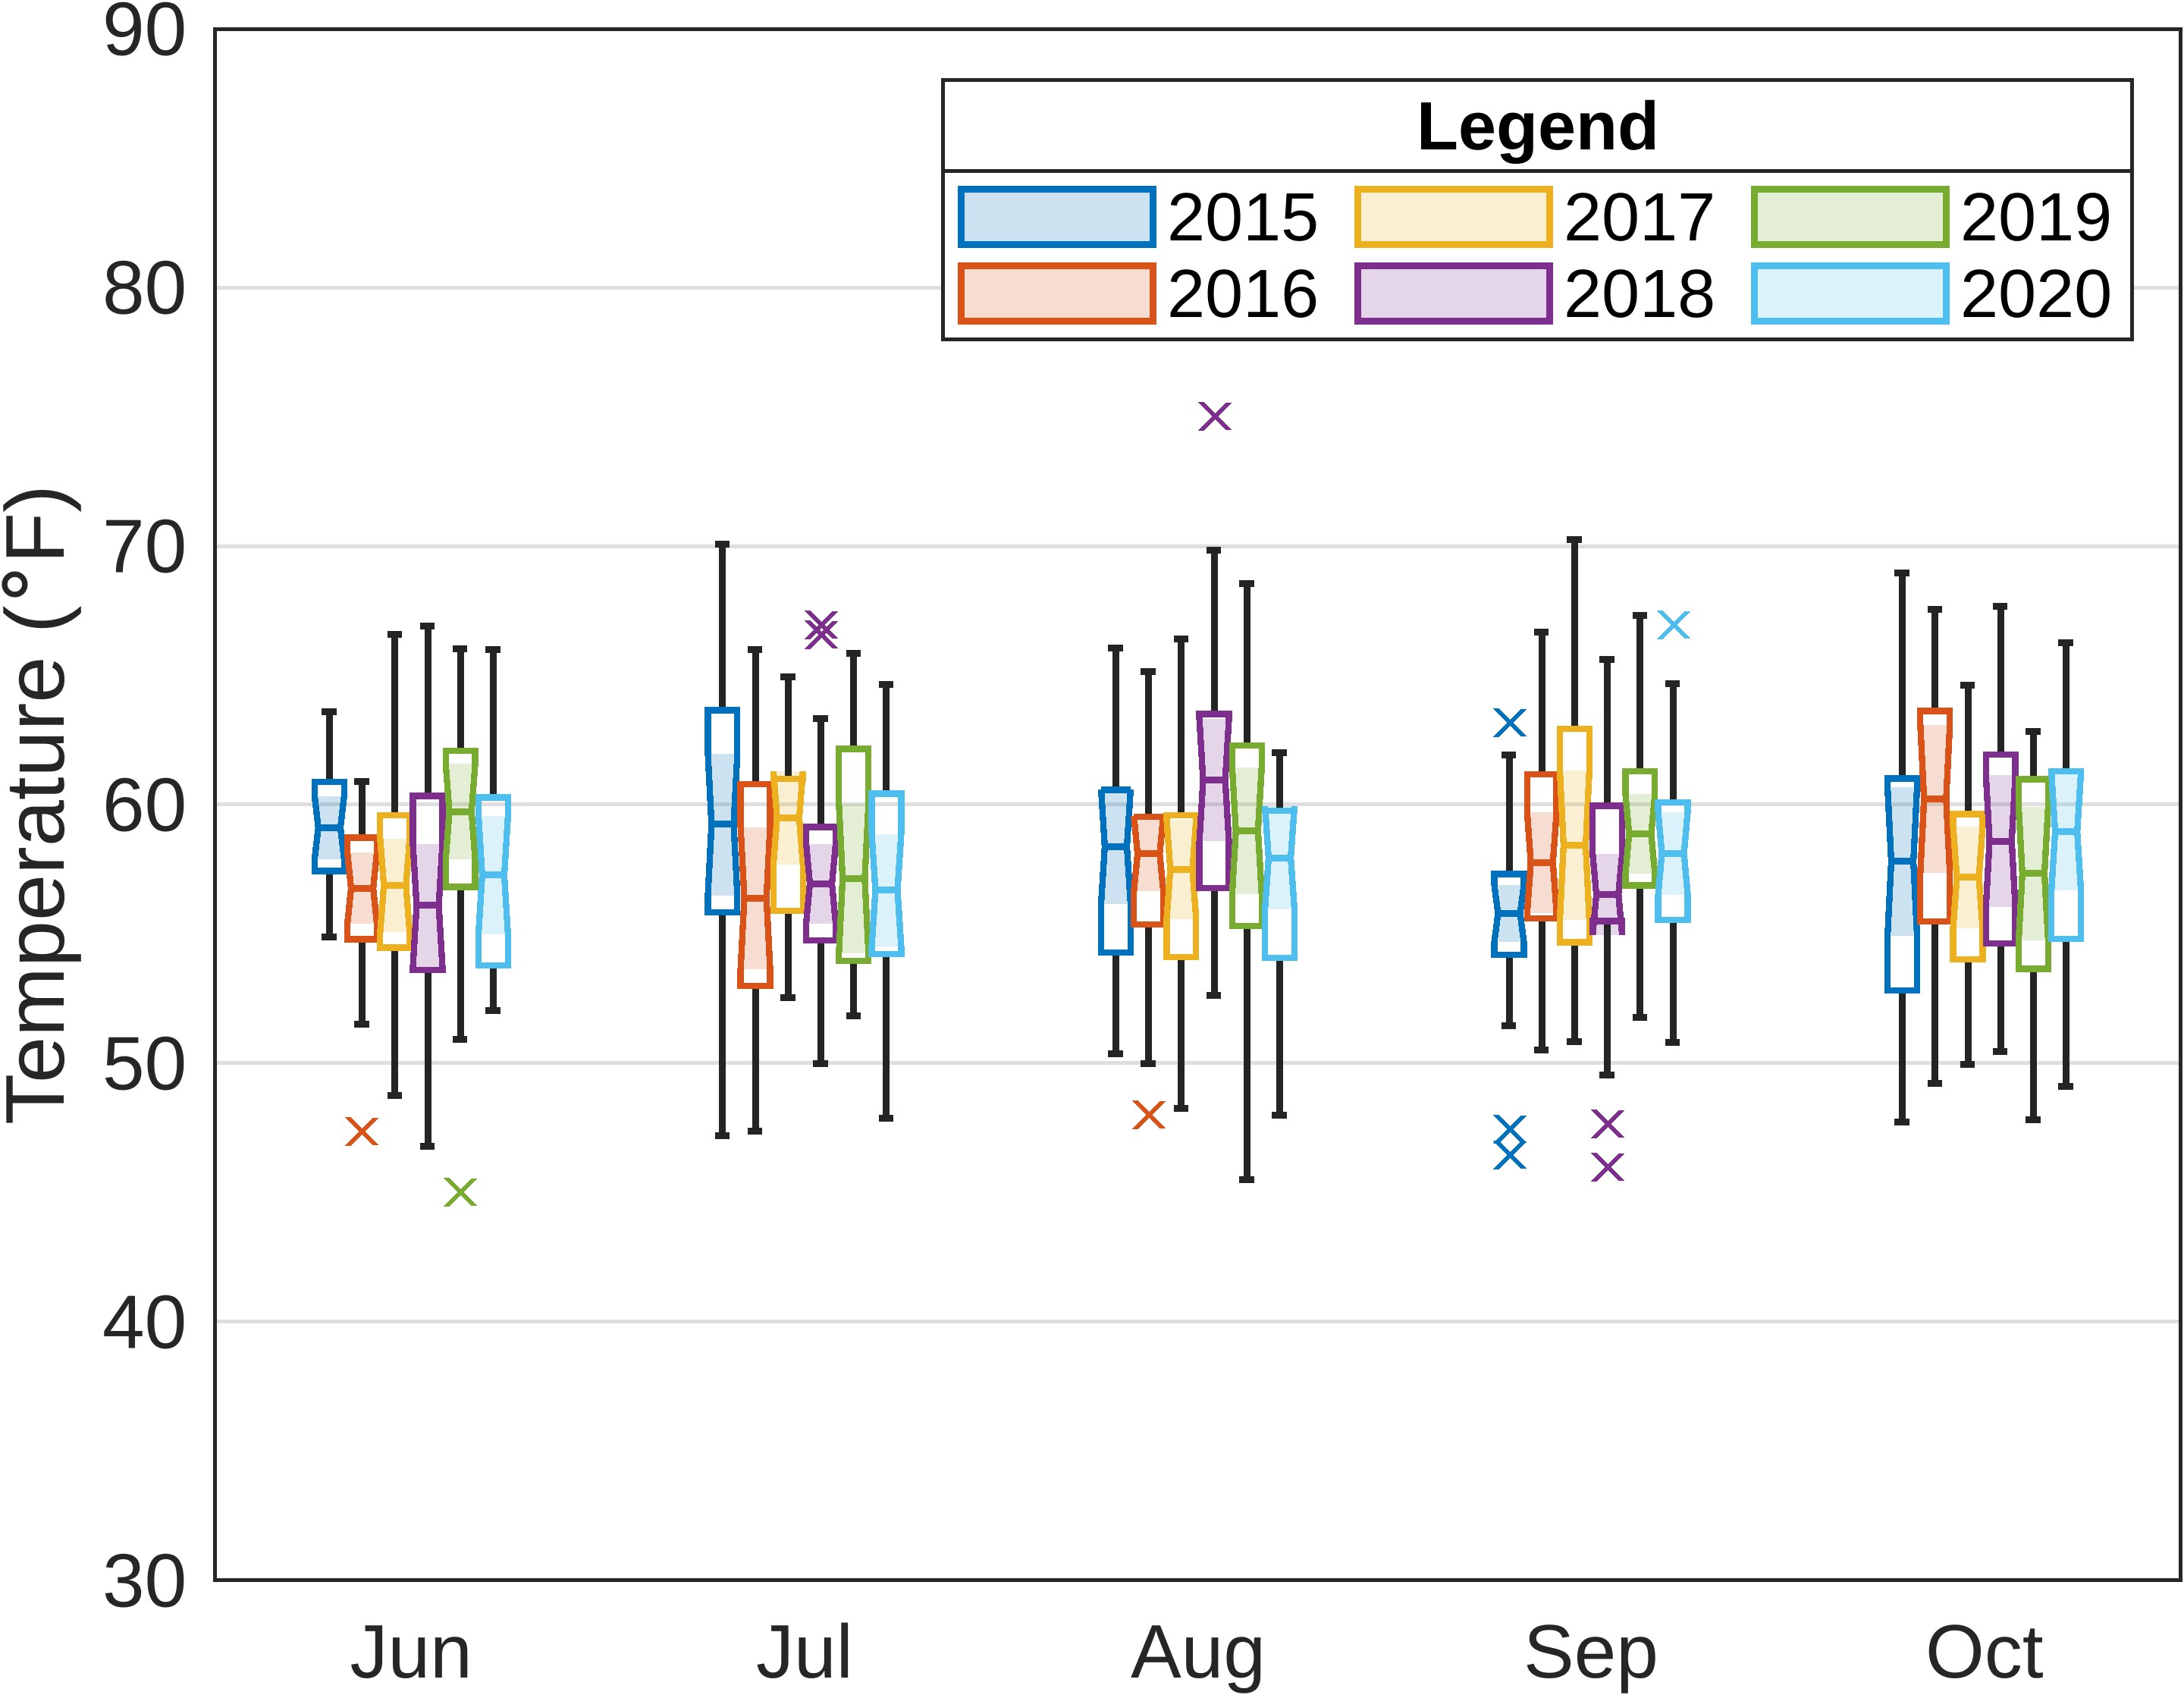
Inspired by Sudhee's question on MATLAB Answers (https://www.mathworks.com/matlabcentral/answers/2120996), the groupedSpacedBoxchart function is a modified version of the base function boxchart. The modified function adds extra space between grouped data in a boxchart visualization, thereby making it easier to distinguish between the groups.
Syntax
-
groupedSpacedBoxchart(dataTable,x,y,groups) -
groupedSpacedBoxchart(...,varargin) -
axHandle = groupedSpacedBoxchart(...)
Inputs
-
dataTable- Table containing your original data -
x- Name of XData variable (ex. 'Month') -
y- Name of YData variable (ex. 'Temperature') -
groups- Name of the variable you wish to group the data by (ex. 'Year') -
varargin- (Optional) name/value pairs compatible with the boxchart() function
Outputs
-
axHandle- Chart axes handle
Examples
 load temperature_data
 plt = groupedSpacedBoxchart(data,'Month','TemperatureF','Year');

 % With optional inputs
 plt2 = groupedSpacedBoxchart(data,'Month','TemperatureF','Year',...
        'BoxWidth',0.5,'MarkerStyle','x','notch','on');
 ylim([20 100]), ylabel('Temperature (\circF)')
 legend(categorical(unique(data.Year)))
Zitieren als
Austin M. Weber (2024). groupedSpacedBoxchart (https://github.com/weber1158/groupedSpacedBoxchart/releases/tag/v0.1.0), GitHub. Abgerufen.
Kompatibilität der MATLAB-Version
Plattform-Kompatibilität
Windows macOS LinuxTags
Community Treasure Hunt
Find the treasures in MATLAB Central and discover how the community can help you!
Start Hunting!Live Editor erkunden
Erstellen Sie Skripte mit Code, Ausgabe und formatiertem Text in einem einzigen ausführbaren Dokument.
| Version | Veröffentlicht | Versionshinweise | |
|---|---|---|---|
| 0.1.0 |


