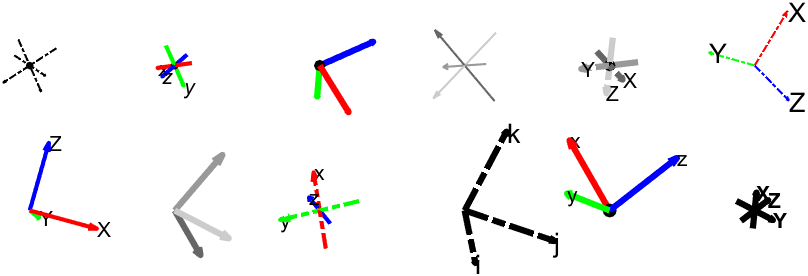
plotframe: Plot a 3-D Cartesian coordinate system
hg = plotframe( rotationMatrix, translationVector, basisVectorLengths, Name=Value )

Sie verfolgen jetzt diese Einreichung
- Aktualisierungen können Sie in Ihrem Feed verfolgter Inhalte sehen.
- Je nach Ihren Kommunikationseinstellungen können Sie auch E-Mails erhalten.
Zitieren als
George Abrahams (2023) (https://www.linkedin.com/in/georgeabrahams). plotframe: Plot a 3-D Cartesian coordinate system (https://github.com/WD40andTape/plotframe/releases/tag/1.0.0), GitHub. Retrieved December 14, 2023.
Allgemeine Informationen
- Version (664 KB)
-
 Lizenz auf GitHub anzeigen
Kompatibilität der MATLAB-Version
- Kompatibel mit R2020b und späteren Versionen
Plattform-Kompatibilität
- Windows
- macOS
- Linux
| Version | Veröffentlicht | Versionshinweise | Action |
|---|---|---|---|
| 1.0.2 | See release notes for this release on GitHub: https://github.com/WD40andTape/plotframe/releases/tag/1.0.2 |
||
| 1.0.1 | See release notes for this release on GitHub: https://github.com/WD40andTape/plotframe/releases/tag/1.0.1 |
||
| 1.0.0 |
Um Probleme in diesem GitHub Add-On anzuzeigen oder zu melden, besuchen Sie das GitHub Repository.
Um Probleme in diesem GitHub Add-On anzuzeigen oder zu melden, besuchen Sie das GitHub Repository.

