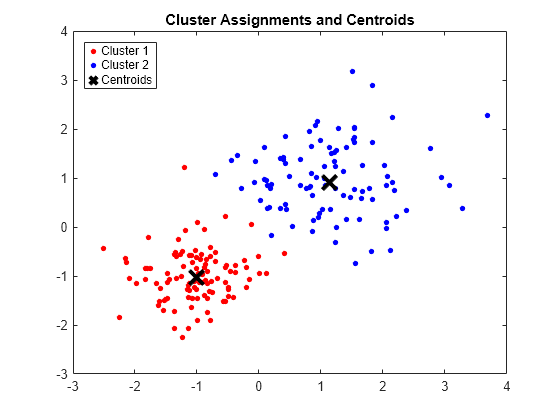
how should i plot these data?
1 Ansicht (letzte 30 Tage)
Ältere Kommentare anzeigen
hey everyone.how should I plot these data in maltba???? as long as every row's data with specific number shoud have specific color.
for example : the datas with rows number 10 should have same color
the datas with rows number 9 should have same color
......
an excel file is attached.
0 Kommentare
Akzeptierte Antwort
KSSV
am 24 Mai 2019
data = xlsread('Book1.xlsx') ;
x = data(:,1) ;
y = data(:,2) ;
plot(x, y); % a basic monochrome plot
% Trick surface into a 2-D plot
surface('XData', [x x], ... % N.B. XYZC Data must have at least 2 cols
'YData', [y y], ...
'ZData', zeros(numel(x),2), ...
'CData', [y y], ...
'FaceColor', 'none', ...
'EdgeColor', 'interp', ...
'Marker', 'none');
5 Kommentare
Weitere Antworten (0)
Siehe auch
Kategorien
Mehr zu 2-D and 3-D Plots finden Sie in Help Center und File Exchange
Community Treasure Hunt
Find the treasures in MATLAB Central and discover how the community can help you!
Start Hunting!

