What inputs for pcolor
Ältere Kommentare anzeigen
Hi,
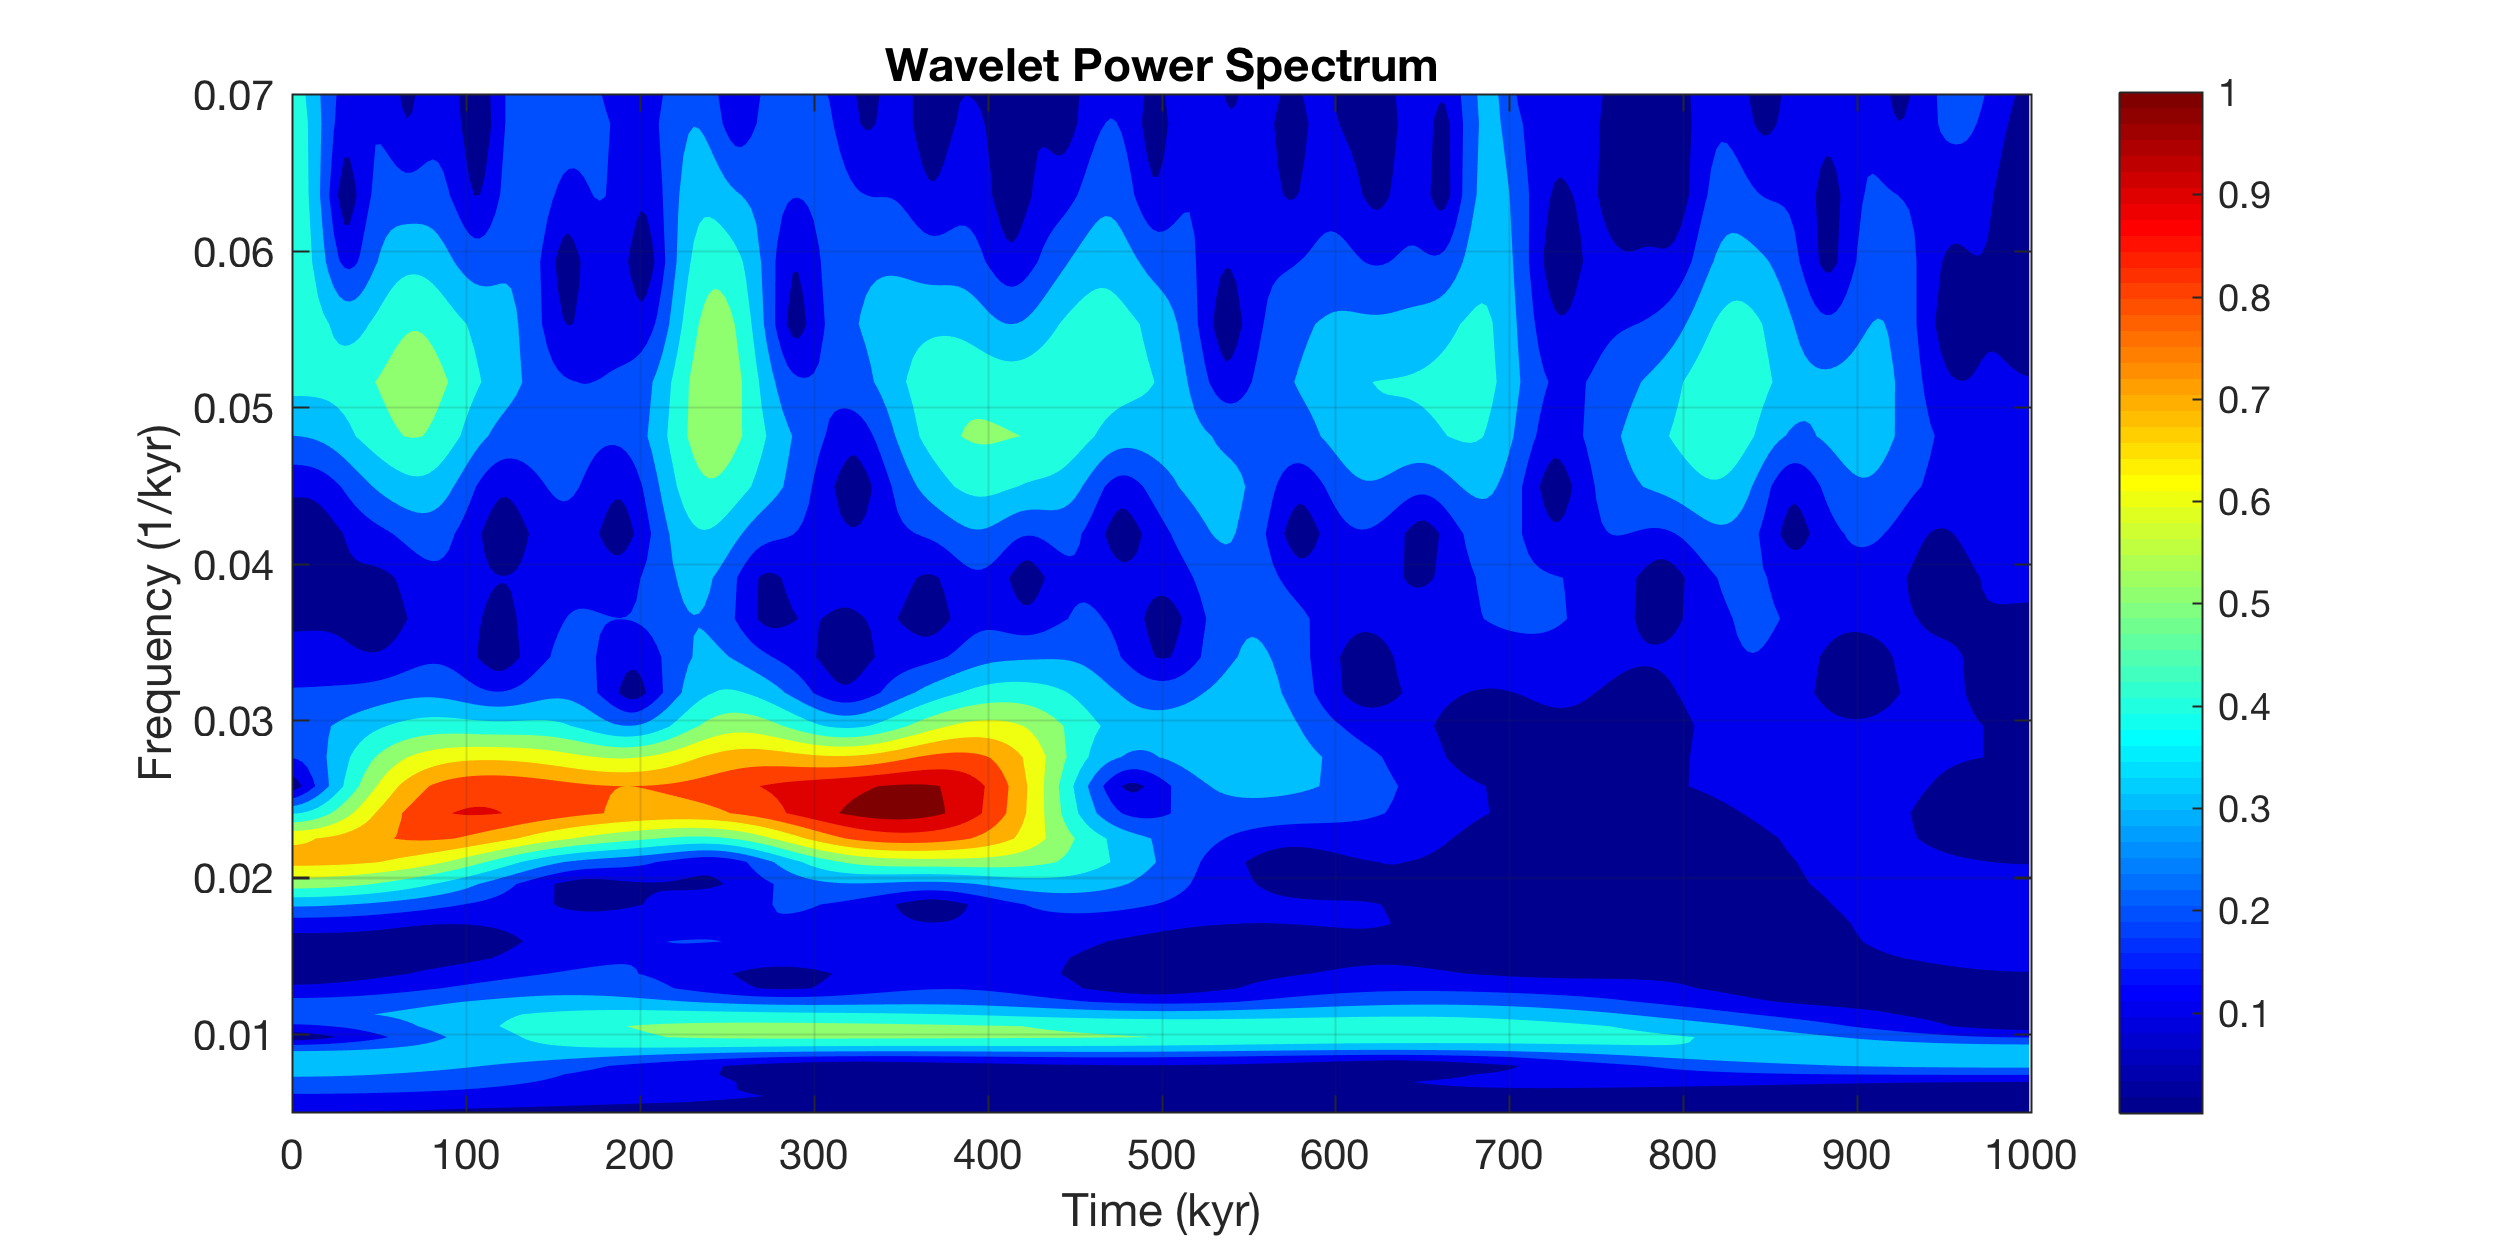
I am trying to generate a plot similar to this one:
I have a set of text files with two columns; Time in s and Velocity in m/s
I have a sampling freq of 20,000
I have generated a PSD using the code:
[Pxx, f] = pwelch(E,[],[],[],Fs);
where E is the all of the velocities and Fs is the sampling freq
How can I generate the above plot? What inputs should I put into the code:
pcolor(x,y,z)
Sizes:
E: 131072 1
f: 16385 1
Pxx: 16385 1
Sorry for the layout of the question, I dont understand enough to know how to ask the question eloquently
1 Kommentar
darova
am 3 Mai 2019
What are your x,y,z? What do you want to plot? Can you attach your data?
Antworten (0)
Kategorien
Mehr zu Parametric Spectral Estimation finden Sie in Hilfe-Center und File Exchange
am 3 Mai 2019
Community Treasure Hunt
Find the treasures in MATLAB Central and discover how the community can help you!
Start Hunting!
Translated by ![]()