Difficult to help unless you provide more information. For example, upload example images and describe your desired output in better detail.
how to plot slice graph from several png files
11 Ansichten (letzte 30 Tage)
Ältere Kommentare anzeigen
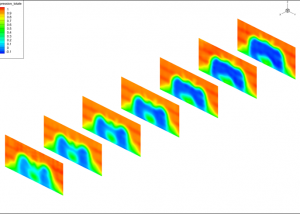
Hello Everybody I have several png files that show displacement varying with time, for a nice visualization I thought that making a slice graph could be a nice idea, I didn't find any example helping me, I would appreciate any help.Thank you
3 Kommentare
Siehe auch
Community Treasure Hunt
Find the treasures in MATLAB Central and discover how the community can help you!
Start Hunting!
Translated by ![]()
Sie können auch eine Website aus der folgenden Liste auswählen:
Amerika
- América Latina (Español)
- Canada (English)
- United States (English)
Europa
- Belgium (English)
- Denmark (English)
- Deutschland (Deutsch)
- España (Español)
- Finland (English)
- France (Français)
- Ireland (English)
- Italia (Italiano)
- Luxembourg (English)
- Netherlands (English)
- Norway (English)
- Österreich (Deutsch)
- Portugal (English)
- Sweden (English)
- Switzerland
- United Kingdom(English)
Asien-Pazifik
- Australia (English)
- India (English)
- New Zealand (English)
- 中国
- 日本Japanese (日本語)
- 한국Korean (한국어)