plotsnr
Description
plotsnr( creates a
plot of signal-to-noise ratio (SNR) information for the factors in the Taguchi design of
experiments (DOE) object dtag,Y)dtag and response data Y.
For more information, see taguchiDOE.
plotsnr(
specifies additional options using one or more name-value arguments. For example, you can
specify the formula to compute the SNR.dtag,Y,Name=Value)
h = plotsnr(___)h) to the lines in the SNR plot.
Examples
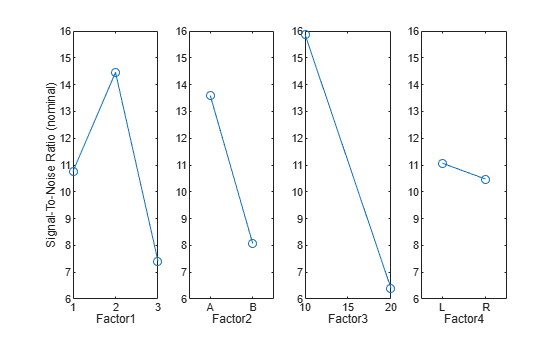
Generate a Taguchi L36 design with four factors and custom levels.
dtag = taguchiDOE([1 2 3],["A" "B"],[10 20],["L" "R"],"L36");
Generate a response value for each run in the taguchiDOE object dtag.
Y = rand([36,1]);
Create a plot of nominal SNR information for the factors and their individual levels.
plotsnr(dtag,Y)
Input Arguments
Name-Value Arguments
Output Arguments
References
[1] Krishnaian, K., and P. Shahabudeen. Applied Design of Experiments and Taguchi Methods. New Delhi: PHI Learning Private Limited, 2012.
Version History
Introduced in R2025a