Hauptinhalt

nctpdf

Noncentral t probability density function

Description

p = nctpdf(x,nu,delta) returns the noncentral t probability density function (pdf) with nu degrees of freedom and the noncentrality parameter delta, evaluated at the values in x.

example

Examples

collapse all

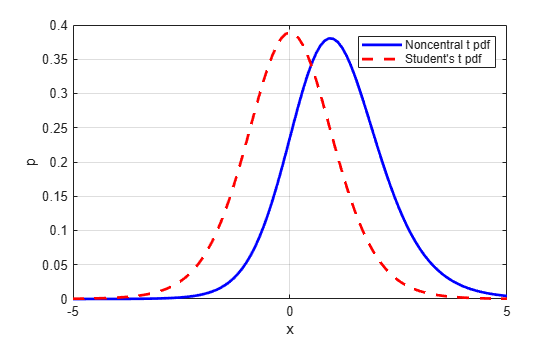
Compute the probability density function (pdf) of a noncentral t distribution with the degrees of freedom nu=10 and noncentrality parameter delta=1. For comparison, also compute the pdf of a Student's t distribution with the same degrees of freedom.

x = -5:0.1:5;
nu = 10;
delta = 1;
nct = nctpdf(x,nu,delta);
t = tpdf(x,nu);

Plot the noncentral t pdf and the Student's t pdf on the same figure.

figure
plot(x,nct,"b-",LineWidth=2)
hold on
grid on
plot(x,t,"r--",Linewidth=2)
xlabel("x")
ylabel("p")
legend("Noncentral t pdf","Student's t pdf")
hold off

Figure contains an axes object. The axes object with xlabel x, ylabel p contains 2 objects of type line. These objects represent Noncentral t pdf, Student's t pdf.

Input Arguments

collapse all

Values at which to evaluate the noncentral t pdf, specified as a numeric scalar or an array of numeric scalars.

To evaluate the pdf at multiple values, specify x as an array. To evaluate the pdfs of multiple distributions, specify either nu or delta (or both) using arrays. If one or more of the input arguments x, nu, and delta are arrays, then the array sizes must be the same. In this case, nctpdf expands each scalar input into a constant array of the same size as the array inputs. Each element in p is the pdf value of the distribution specified by the corresponding elements in nu and delta, evaluated at the corresponding element in x.

Data Types: single | double

Degrees of freedom, specified as a positive scalar or an array of positive scalars.

To evaluate the pdf at multiple values, specify x as an array. To evaluate the pdfs of multiple distributions, specify either nu or delta (or both) using arrays. If one or more of the input arguments x, nu, and delta are arrays, then the array sizes must be the same. In this case, nctpdf expands each scalar input into a constant array of the same size as the array inputs. Each element in p is the pdf value of the distribution specified by the corresponding elements in nu and delta, evaluated at the corresponding element in x.

Data Types: single | double

Noncentrality parameter, specified as a numeric scalar or array.

To evaluate the pdf at multiple values, specify x as an array. To evaluate the pdfs of multiple distributions, specify either nu or delta (or both) using arrays. If one or more of the input arguments x, nu, and delta are arrays, then the array sizes must be the same. In this case, nctpdf expands each scalar input into a constant array of the same size as the array inputs. Each element in p is the pdf value of the distribution specified by the corresponding elements in nu and delta, evaluated at the corresponding element in x.

Data Types: single | double

Output Arguments

collapse all

Noncentral t pdf values evaluated at the values in x, returned as a numeric scalar or array. p is the same size as x, nu, and delta after any necessary scalar expansion. Each element in p is the pdf value of the distribution specified by the corresponding elements in nu and delta, evaluated at the corresponding element in x.

Alternative Functionality

  • nctpdf is a function specific to the noncentral t distribution. Statistics and Machine Learning Toolbox™ also offers the generic function pdf, which supports various probability distributions. To use pdf, specify the probability distribution name and its parameters. Note that the distribution-specific function nctpdf is faster than the generic function pdf.

  • Use the Probability Distribution Function Tool to create an interactive plot of the cumulative distribution function (cdf) or probability density function (pdf) for a probability distribution.

References

[1] Evans, M., N. Hastings, and B. Peacock. Statistical Distributions. 2nd ed., Hoboken, NJ: John Wiley & Sons, Inc., 1993, pp. 147–148.

[2] Johnson, N., and S. Kotz. Distributions in Statistics: Continuous Univariate Distributions-2. Hoboken, NJ: John Wiley & Sons, Inc., 1970.

Extended Capabilities

expand all

C/C++ Code Generation
Generate C and C++ code using MATLAB® Coder™.

Version History

Introduced before R2006a