Probability Distribution Function Tool
Interactive density and distribution plots
Description
The Probability Distribution Function tool creates an interactive plot of the cumulative distribution function (cdf) or probability density function (pdf) for a probability distribution. Explore the effects of changing parameter values on the shape of the plot, either by specifying parameter values or using interactive sliders.
Required Products
MATLAB®
Statistics and Machine Learning Toolbox™
Note:
disttool does not provide printing, code generating, or data
importing functionality in MATLAB
Online™.
Open the Probability Distribution Function Tool
At the command prompt, enter
disttool.
Examples
This example shows how to use the Probability Distribution Function Tool to explore the shape of cdf and pdf plots for different probability distributions and parameter values.
Open the Probability Distribution Function tool.
disttool
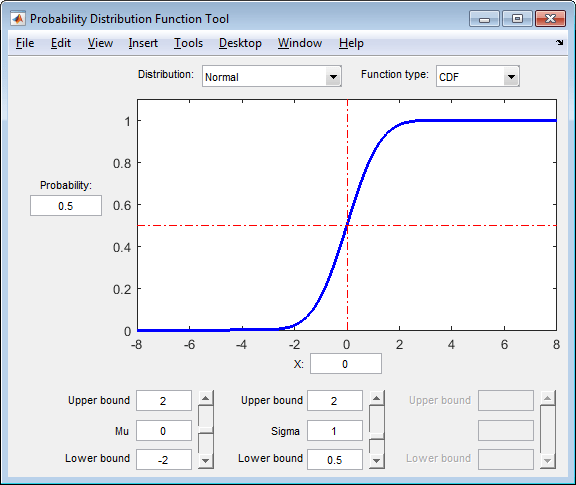
The interface opens with a plot of the cdf of the Normal distribution. The
initial parameter settings are Mu = 0 and Sigma
= 1.
Select PDF from the Function
type drop-down menu to plot the pdf of the Normal
distribution using the same parameter values.

Change the value of the location parameter Mu to
1.
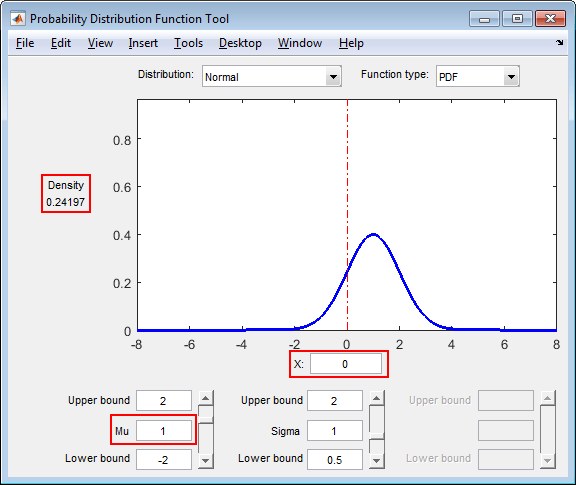
As the parameter values change, the shape of the plot also changes. Also,
the value of X remains the same, but the density value
changes because of the new parameter value.
Use the Distribution drop-down menu to change the
distribution type from Normal to
Weibull.
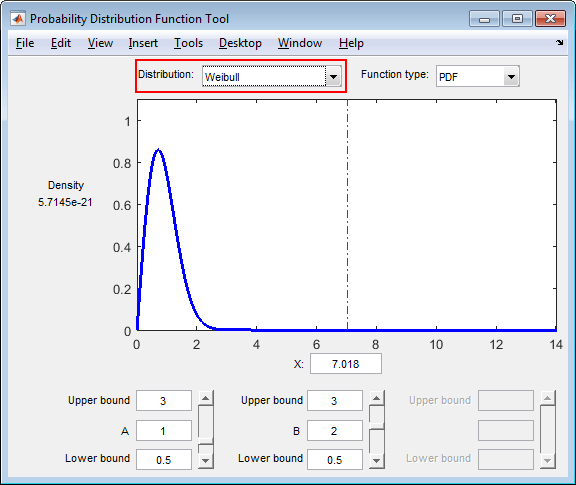
The shape of the plot changes, along with the names and values of the parameters.
Parameters
Tips
To change the value of X (on the y-axis), or Probability or Density (on the x-axis):
Type the values of interest into the Probability or X fields;
Click on the point of interest on the plot; or
Click and drag the reference lines across the plot.
Version History
Introduced before R2006a