Monitor Equipment State of Health Using Drift-Aware Learning on the Cloud
This example describes the set up necessary to run the deployed version of the Monitor Equipment State of Health Using Drift-Aware Learning example on the cloud. The topic shows how to automate the process of monitoring the state of health for a cooling system using an incremental drift-aware learning model using the infrastructure in the next figure. This example requires Statistics and Machine Learning Toolbox™, MATLAB® Compiler SDK™, MATLAB Production Server™, and MATLAB Web App Server™.
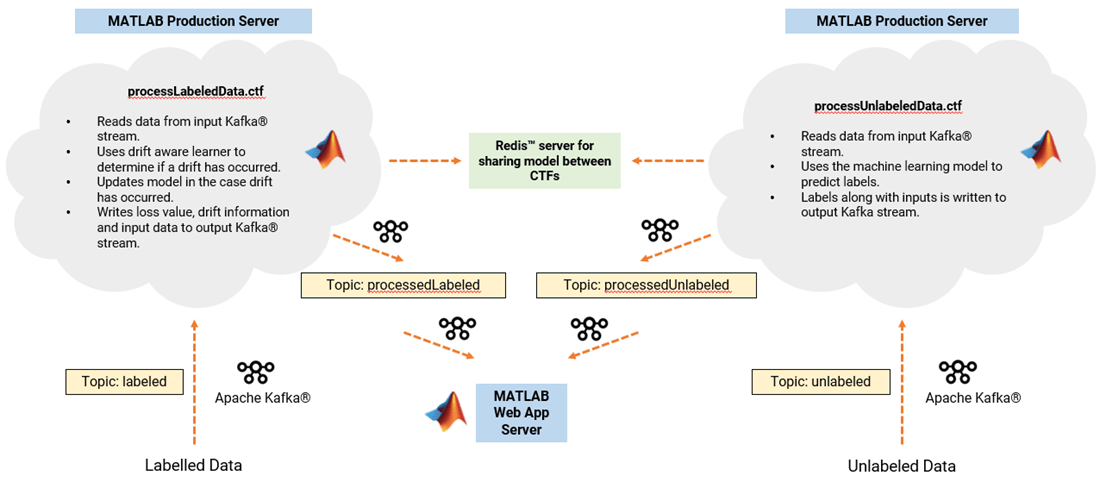
The following figure shows the architecture for drift-aware learning. The architecture involves two analytics functions processUnlabeledData.ctf and processLabeledData.ctf that are deployed on the MATLAB Production Server (MPS).
The processUnlabeledData.ctf loads the model, uses it to predict the health of the equipment, and writes the sensor readings and predictions to the output topic processedUnlabeled. The processedLabeledData.ctf reads the labeled data from input topic labeled and uses the labeled data to check the model for drift. It then outputs the labeled data, along with the drift diagnostic information, into the output topic processedLabeled.
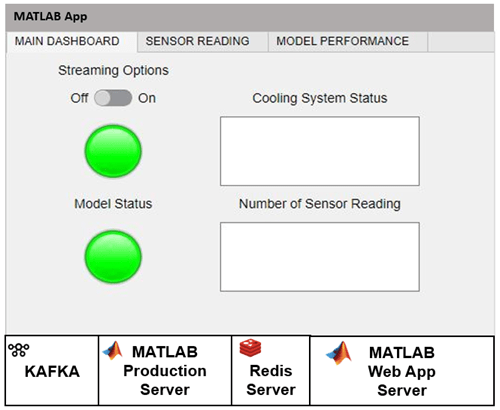
A dashboard deployed on the Web App Server then reads the processed data. The dashboard enables to visually inspect the sensor readings and model performance.
Redis server enables the updated model to be shared between the labeled and unlabeled component technology files (CTFs).
Upload Sensor Readings
Start Kafka server from a dockerized container.
To upload sensor readings, you must first create the Kafka topics: unlabeled, labeled, processedUnlabeled, and processedLabeled. You must have a Kafka server running at kafka.host.com at port number 9092 for this example. For more details on uploading data using a Kafka server, see Streaming Data Framework for MATLAB Production Server Basics (MATLAB Production Server).
Upload readings via uploadApp.
Similar to the Monitor Equipment State of Health Using Drift-Aware Learning example, upload the unlabeled and labeled data (provided in UnlabeledData.mat and LabeledData.mat) to the Kafka server using the unlabeled and labeled topics via the uploadApp2, also provided as a supporting file. The uploadApp2 deployable archive runs on the Web App Server. To learn more about how to set up a deployable archive on Web App Server, refer to the instructions in Create Web App (MATLAB Compiler).

After deploying the uploadApp2, click Start Streaming. The app uploads 60,000 unlabeled sensor readings and 6000 labeled sensor readings, stored in the files unlabeledData.mat and labeledData.mat, respectively. Each sensor reading is sampled every 0.1 second.
The Upload Status light turns red while the app uploads the unlabeled and labeled data. When the upload is complete, the status light turns green. The Kafka server now contains data that can be accessed by anyone responsible for maintaining a cooling system.
Monitor Cooling System
To start monitoring the cooling system, first you must create the deployable archives processUnlabeledData.ctf and processLabeledData.ctf. To deploy these two archives, you must have the MATLAB Production Server running. Start with processUnlabeledData.ctf first since it loads the drift-aware learning model into the Redis cache. The model is a warmed-up incremental drift-aware learner with incremental Naive Bayes classification model as the base learner.
Create deployable archive processUnlabeledData.ctf and move it to MPS.
Package processUnlabeledData.ctf into a deployable archive by running the below script in the supporting file createCTFUnlabeled.m.
kafkaHost = "kafka.host.com";
kafkaPort = 9092;

inputKS = kafkaStream(kafkaHost,kafkaPort,"unlabeled","Rows",1200,"RequestTimeout", 60,'TimestampResolution','Seconds');
outputKS = kafkaStream(kafkaHost,kafkaPort,"processedUnlabeled","Rows",1200,"RequestTimeout",60);

archive = streamingDataCompiler("processUnlabeledData",inputKS,outputKS,StateStore="LocalRedis",InitialState="initUnlabeledData");
To learn more about these steps, see Package Streaming Analytic Function (MATLAB Production Server) and Deploy Streaming Analytic Function to Server (MATLAB Production Server).
Start Kafka connector.
Start Kafka connector at port 1234 for processUnlabeledData.ctf.
Windows
powershell -executionPolicy bypass -File kafka-connector-start.ps1 -out out.log -err error.log -c collector.properties -k kafka.properties -p "1234"
Linux
chmod +x kafka-connector-start.sh
!./kafka-connector-start.sh -out out.log -err error.log -c collector.properties -k kafka.properties -p "1234"Starting the Kafka connector initializes processUnlabeledData.ctf, that is, uploads the warm incremental drift-aware learner model and the processUnlabeledData deployable archive listens for data in the input topic unlabeled.
Create deployable archive processLabeledData and move it to MPS.
Repeat the above steps to create and deploy processLabeledData.ctf using the supporting file createCTFLabeled.m and start the Kafka connector at port 1235 for the processLabeledData.ctf. The processLabeledData archive begins to read the labeled data and updates the model parameters in the event of a drift in the data distribution. The Redis cache allows for the model to be shared between the two deployable archives.
Open the dashboard app hosted on Web App Server.
The output topics processedUnlabeled and processedLabeled contain the processed data. Once both processUnlabeledData.ctf and processLabeledData.ctf are processed, the processedUnlabeled topic contains the sensor readings along with the model predictions, whereas the processLabeled topic contains the sensor readings along with the model drift diagnostic information.
The dashboard2 app reads the processed data from the processedUnlabeled and processedLabeled topics. The app runs on the Web App Server, deploy the dashboard2 app using the MATLAB Web App server by following the instructions in Create Web App (MATLAB Compiler).
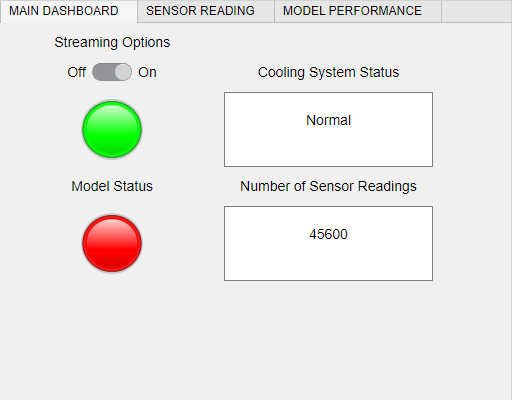
Once deployed, the dashboard2 app is ready to start streaming the data uploaded to the Kafka server. You can initiate the streaming process by setting Streaming Options to On.
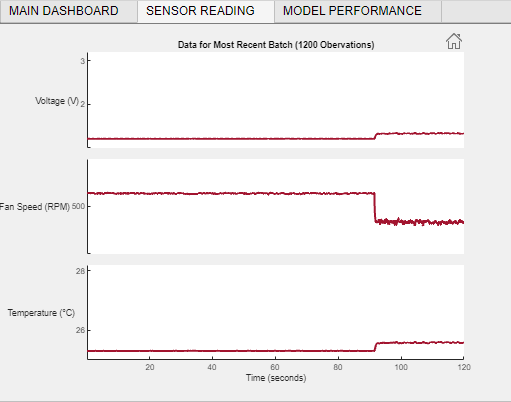
View the Sensor Reading tab to inspect the sensor readings of the data received in the previous two minutes.
View the Model Performance tab to monitor the drift in the data.

See Also
incrementalDriftAwareLearner | perObservationLoss