lassoPlot
Trace plot of lasso fit
Description
lassoPlot( creates a trace plot of the
values in B)B against the
L1 norm of B.
lassoPlot(
creates a plot with additional options specified by one or more name-value arguments.B,FitInfo,Name=Value)
Examples
Load the sample data.
load acetylenePrepare the design matrix for lasso fit with interactions. The x2fx function returns the quadratic model in the order of a constant term, linear terms and interaction terms: constant term, x1, x2, x3, x1.*x2, x1.*x3, and x2.*x3.
X = [x1 x2 x3];
D = x2fx(X,"interaction");
D(:,1) = []; % No constant term
Fit a regularized model of the data using the lasso function.
B = lasso(D,y);
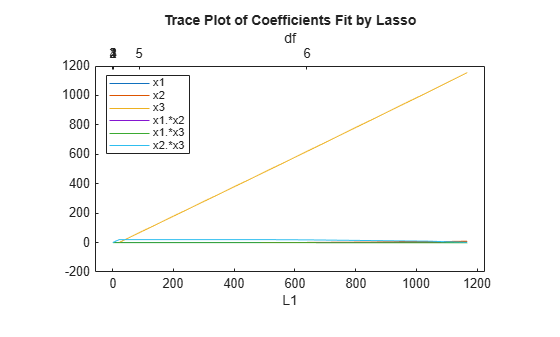
Plot the lasso fits with labeled coefficients by using the PredictorNames name-value argument. Each line represents a trace of the values in B for a single predictor variable: x1, x2, x3, x1.*x2, x1.*x3, and x2.*x3.
lassoPlot(B,PredictorNames=["x1" "x2" "x3" "x1.*x2" "x1.*x3" "x2.*x3"]);
legend(Location="NorthWest")
Load the sample data.
load acetylenePrepare the data for lasso fit with interactions.
X = [x1 x2 x3];
D = x2fx(X,"interaction");
D(:,1) = []; % No constant term
Fit a regularized model of the data using the lasso function.
[B,FitInfo] = lasso(D,y);
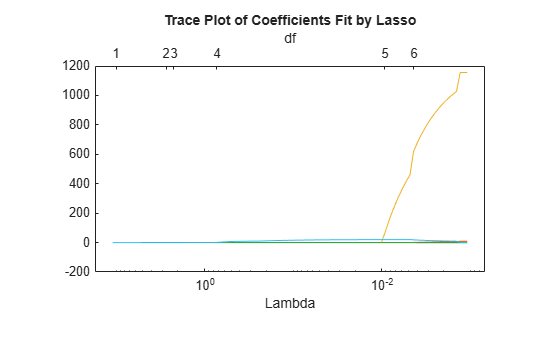
Plot the fits with the Lambda plot type and logarithmic scaling.
lassoPlot(B,FitInfo,PlotType="Lambda",XScale="log");
Visually examine the cross-validated error of various levels of regularization.
Load the sample data.
load acetyleneCreate a design matrix with interactions and no constant term.
X = [x1 x2 x3];
D = x2fx(X,"interaction");
D(:,1) = []; % No constant term
Construct the lasso fit using 10-fold cross-validation. Include the FitInfo output so you can plot the result.
rng default % For reproducibility
[B,FitInfo] = lasso(D,y,CV=10);
Plot the cross-validated fits. The green circle and dotted line locate the Lambda with minimum cross-validation error. The blue circle and dotted line locate the point with minimum cross-validation error plus one standard error.
lassoPlot(B,FitInfo,PlotType="CV");
legend("show")

Input Arguments
Name-Value Arguments
Output Arguments
Version History
Introduced in R2011b