Dimensionalitätsreduzierung und Merkmalsextraktion
R2026bTechniken zur Merkmalstransformation reduzieren die Dimensionalität der Daten, indem Daten in neue Merkmale transformiert werden. Techniken zur Merkmalsauswahl sollten bevorzugt werden, wenn eine Transformation von Variablen nicht möglich ist, beispielsweise wenn kategorische Variablen in den Daten vorliegen. Eine Technik zur Merkmalsauswahl, die sich besonders für die Least-Squares-Anpassung eignet, finden Sie unter Schrittweise Regression.
Live Editor Tasks
| Reduzieren der Dimensionalität | Reduce dimensionality using Principal Component Analysis (PCA) in Live Editor (Seit R2022b) |
Funktionen
Objekte
Themen
Merkmalsauswahl
- Introduction to Feature Selection
Learn about feature selection algorithms and explore the functions available for feature selection. - Sequential Feature Selection
This topic introduces sequential feature selection and provides an example that selects features sequentially using a custom criterion and thesequentialfsfunction. - Neighborhood Component Analysis (NCA) Feature Selection
Neighborhood component analysis (NCA) is a non-parametric method for selecting features with the goal of maximizing prediction accuracy of regression and classification algorithms.
- Regularize Discriminant Analysis Classifier
Make a more robust and simpler model by removing predictors without compromising the predictive power of the model. - Select Predictors for Random Forests
Select split-predictors for random forests using interaction test algorithm.
Merkmalsextraktion
- Feature Extraction
Feature extraction is a set of methods to extract high-level features from data. - Feature Extraction Workflow
This example shows a complete workflow for feature extraction from image data. - Extract Mixed Signals
This example shows how to usericato disentangle mixed audio signals.
Multidimensionale t-SNE-Visualisierung
- t-SNE
t-SNE is a method for visualizing high-dimensional data by nonlinear reduction to two or three dimensions, while preserving some features of the original data. - Visualize High-Dimensional Data Using t-SNE
This example shows how t-SNE creates a useful low-dimensional embedding of high-dimensional data. - Modify t-SNE Settings
This example shows the effects of varioustsnesettings. - t-SNE Output Function
Output function description and example for t-SNE.
PCA und kanonische Korrelation
- Principal Component Analysis (PCA)
Principal Component Analysis reduces the dimensionality of data by replacing several correlated variables with a new set of variables that are linear combinations of the original variables. - Analyze and Model Data on GPU
Accelerate your code by using GPU array input arguments. - Analyze Quality of Life in US Cities Using PCA
Perform a weighted principal components analysis and interpret the results.
Faktoranalyse
- Factor Analysis
Factor analysis is a way to fit a model to multivariate data to estimate interdependence of measured variables on a smaller number of unobserved (latent) factors. - Analyze Stock Prices Using Factor Analysis
Use factor analysis to investigate whether companies within the same sector experience similar week-to-week changes in stock prices. - Perform Factor Analysis on Exam Grades
This example shows how to perform factor analysis using Statistics and Machine Learning Toolbox™.
Nichtnegative Matrix-Faktorisierung
- Nonnegative Matrix Factorization
Nonnegative matrix factorization (NMF) is a dimension-reduction technique based on a low-rank approximation of the feature space. - Perform Nonnegative Matrix Factorization
Perform nonnegative matrix factorization using the multiplicative and alternating least-squares algorithms.
Multidimensionale Skalierung
- Multidimensional Scaling
Multidimensional scaling allows you to visualize how near points are to each other for many kinds of distance or dissimilarity metrics and can produce a representation of data in a small number of dimensions. - Classical Multidimensional Scaling
Usecmdscaleto perform classical (metric) multidimensional scaling, also known as principal coordinates analysis. - Classical Multidimensional Scaling Applied to Nonspatial Distances
This example shows how to perform classical multidimensional scaling using thecmdscalefunction in Statistics and Machine Learning Toolbox™. - Nonclassical Multidimensional Scaling
This example shows how to visualize dissimilarity data using nonclassical forms of multidimensional scaling (MDS). - Nonclassical and Nonmetric Multidimensional Scaling
Perform nonclassical multidimensional scaling usingmdscale.
Procrustes-Analyse
- Compare Handwritten Shapes Using Procrustes Analysis
Use Procrustes analysis to compare two handwritten numerals.
Enthaltene Beispiele
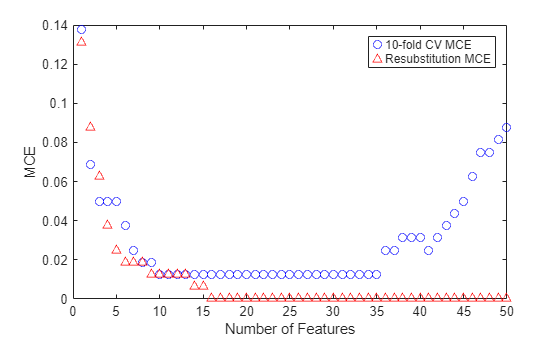
Select Features for Classifying High-Dimensional Data
Select features for classifying high-dimensional data. More specifically, it shows how to perform sequential feature selection, which is one of the most popular feature selection algorithms. It also shows how to use holdout and cross-validation to evaluate the performance of the selected features.
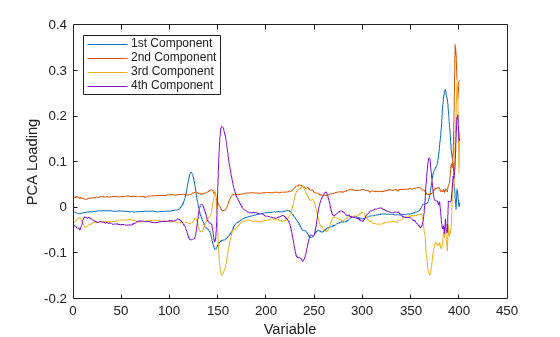
Partial Least Squares Regression and Principal Components Regression
Apply partial least squares regression (PLSR) and principal components regression (PCR), and explore the effectiveness of the two methods.
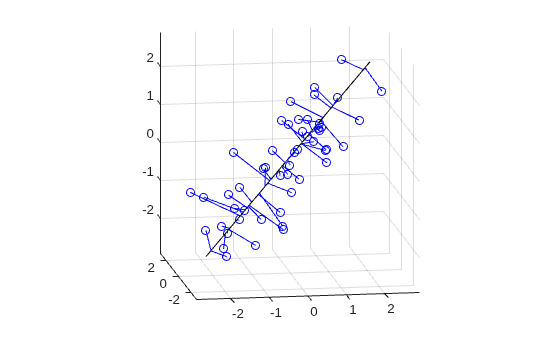
Fitting an Orthogonal Regression Using Principal Components Analysis
Use Principal Components Analysis (PCA) to fit a linear regression. PCA minimizes the perpendicular distances from the data to the fitted model. This is the linear case of what is known variously as Orthogonal Regression, Total Least Squares, Deming Regression, or Errors-in-variables, and is appropriate when there is no natural distinction between predictor and response variables, or when all variables are measured with error. This is in contrast to the usual regression assumption that predictor variables are measured exactly, and only the response variable has an error component.

