predictError
Predict error value at a set of points
Description
Examples
This example shows optimizing a function that throws an error when the evaluation point has norm larger than 2. The error model for the objective function learns this behavior.
Create variables named x1 and x2 that range from -5 to 5.
var1 = optimizableVariable('x1',[-5,5]); var2 = optimizableVariable('x2',[-5,5]); vars = [var1,var2];
The following objective function throws an error when the norm of x = [x1,x2] exceeds 2:
function f = makeanerror(x)
f = x.x1 - x.x2 - sqrt(4-x.x1^2-x.x2^2);
fun = @makeanerror;
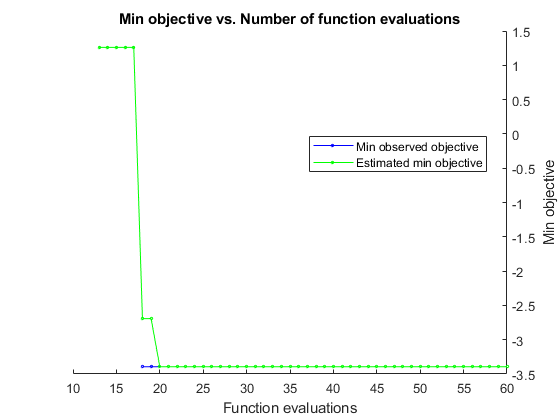
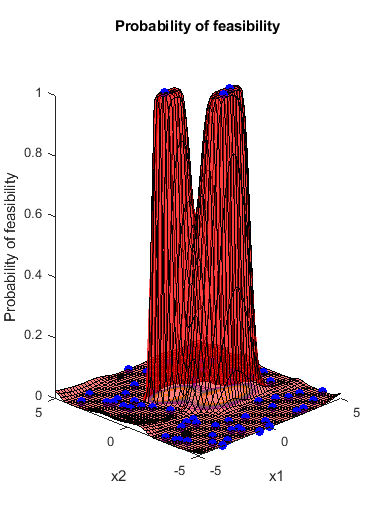
Plot the error model and minimum objective as the optimization proceeds. Optimize for 60 iterations so the error model becomes well-trained. For reproducibility, set the random seed and use the 'expected-improvement-plus' acquisition function.
rng default results = bayesopt(fun,vars,'Verbose',0,'MaxObjectiveEvaluations',60,... 'AcquisitionFunctionName','expected-improvement-plus',... 'PlotFcn',{@plotMinObjective,@plotConstraintModels});


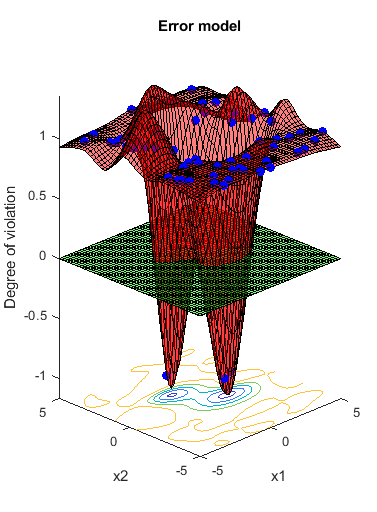
Predict the error at points on the line x1 = x2. If the error model were perfect, it would have value -1 at every point where the norm of x is no more than 2, and value 1 at all other points.
x1 = (-5:0.5:5)'; x2 = x1; XTable = table(x1,x2); error = predictError(results,XTable); normx = sqrt(x1.^2 + x2.^2); [XTable,table(normx,error)]
ans =
21x4 table
x1 x2 normx error
____ ____ _______ _________
-5 -5 7.0711 0.94663
-4.5 -4.5 6.364 0.97396
-4 -4 5.6569 0.99125
-3.5 -3.5 4.9497 1.0033
-3 -3 4.2426 1.0018
-2.5 -2.5 3.5355 0.99627
-2 -2 2.8284 1.0043
-1.5 -1.5 2.1213 0.89886
-1 -1 1.4142 0.4746
-0.5 -0.5 0.70711 0.0042389
0 0 0 -0.16004
0.5 0.5 0.70711 -0.012397
1 1 1.4142 0.30187
1.5 1.5 2.1213 0.88588
2 2 2.8284 1.0872
2.5 2.5 3.5355 0.997
3 3 4.2426 0.99861
3.5 3.5 4.9497 0.98894
4 4 5.6569 0.98941
4.5 4.5 6.364 0.98956
5 5 7.0711 0.95549
Input Arguments
Bayesian optimization results, specified as a BayesianOptimization object.
Prediction points, specified as a table with D columns, where D is the number of variables in the problem. The function performs its predictions on these points.
Data Types: table
Output Arguments
Mean of error coupled constraint, returned as an
N-by-1 vector, where
N is the number of rows of
XTable. The mean is the posterior mean of the error
coupled constraint at the points in XTable.
bayesopt deems your objective function to return an
error if it returns anything other than a finite real scalar. See Objective Function Errors.
Standard deviation of error coupled constraint, returned as an
N-by-1 vector, where
N is the number of rows of
XTable.
Version History
Introduced in R2016b
See Also
MATLAB Command
You clicked a link that corresponds to this MATLAB command:
Run the command by entering it in the MATLAB Command Window. Web browsers do not support MATLAB commands.
Website auswählen
Wählen Sie eine Website aus, um übersetzte Inhalte (sofern verfügbar) sowie lokale Veranstaltungen und Angebote anzuzeigen. Auf der Grundlage Ihres Standorts empfehlen wir Ihnen die folgende Auswahl: .
Sie können auch eine Website aus der folgenden Liste auswählen:
So erhalten Sie die bestmögliche Leistung auf der Website
Wählen Sie für die bestmögliche Website-Leistung die Website für China (auf Chinesisch oder Englisch). Andere landesspezifische Websites von MathWorks sind für Besuche von Ihrem Standort aus nicht optimiert.
Amerika
- América Latina (Español)
- Canada (English)
- United States (English)
Europa
- Belgium (English)
- Denmark (English)
- Deutschland (Deutsch)
- España (Español)
- Finland (English)
- France (Français)
- Ireland (English)
- Italia (Italiano)
- Luxembourg (English)
- Netherlands (English)
- Norway (English)
- Österreich (Deutsch)
- Portugal (English)
- Sweden (English)
- Switzerland
- United Kingdom (English)