summary
Description
summary( displays the
objective function name, constraint function name, and a summary of the results for the
hyperparameter optimization problems in the AggregateResults)AggregateBayesianOptimization object
AggregateResults.
S = summary(AggregateResults)S containing the hyperparameter optimization results
summary.
Examples
Display and plot the results of a set of hyperparameter optimization problems stored in an AggregateBayesianOptimization object.
Load the ionosphere data set.
load ionosphere.matTrain a support vector machine classification model and optimize all eligible model hyperparameters for three optimization problems using the fitcsvm function. For each problem, specify to use the size of the compact version of the trained model as the constraint, and to suppress the display of the command-line output and plots. Specify the constraint bounds as 0 to 10000 bytes for the first problem, 0 to 100000 bytes for the second problem, and 0 to 200000 bytes for the third problem. Use the 'expected-improvement-plus' acquisition function for reproducibility. Use the default settings for the other hyperparameter optimization options.
rng(0,"twister"); % For reproducibility
[Mdl,hpoResults]=fitcsvm(X,Y,OptimizeHyperparameters="all", ...
    HyperparameterOptimizationOptions=struct(ConstraintType="size", ...
    Verbose=0, ShowPlots=false, ConstraintBounds=[10000; 100000; 200000], ...
    AcquisitionFunctionName="expected-improvement-plus"));
Display a summary of the hyperparameter optimization results.
summary(hpoResults)
Objective:     kfoldLoss
Constraint:    CompactModelSize (bytes)

                MinObjective    ConstraintAtMinObjective    ConstraintBounds    ConstraintBoundsAreSatisfied    Feasible    LearnerAtMinObjective
                ____________    ________________________    ________________    ____________________________    ________    _____________________

    Result_1      0.079772               21553                 0    10000                  false                 false       "ClassificationSVM"
    Result_2      0.079772               36821                 0    1e+05                  true                  true        "ClassificationSVM"
    Result_3      0.071225               31093                 0    2e+05                  true                  true        "ClassificationSVM"
The first model has a constraint (CompactModelSize) value of 21553 bytes at the minimum value of the objective function (kfoldLoss). Because this value is outside the constraint bounds [0,10000], the model is not feasible. The other two models satisfy their constraint bounds and are feasible.
Plot the model results.
plot(hpoResults)
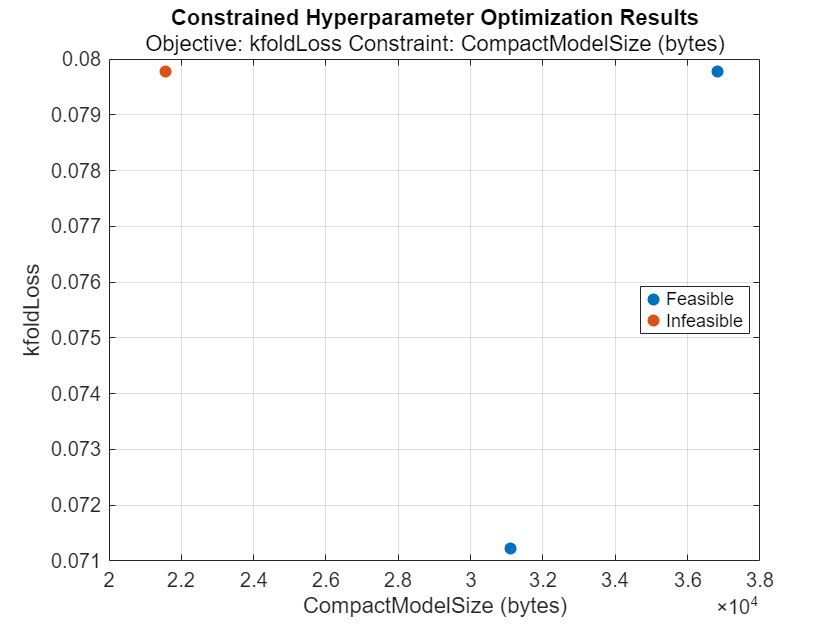
The figure shows a scatter plot of the final value of the objective function (kfoldLoss) versus the final value of the constraint function (CompactModelSize) for each model in the set of hyperparameter optimization problems. The blue points indicate feasible models, and the red point indicates an infeasible model.
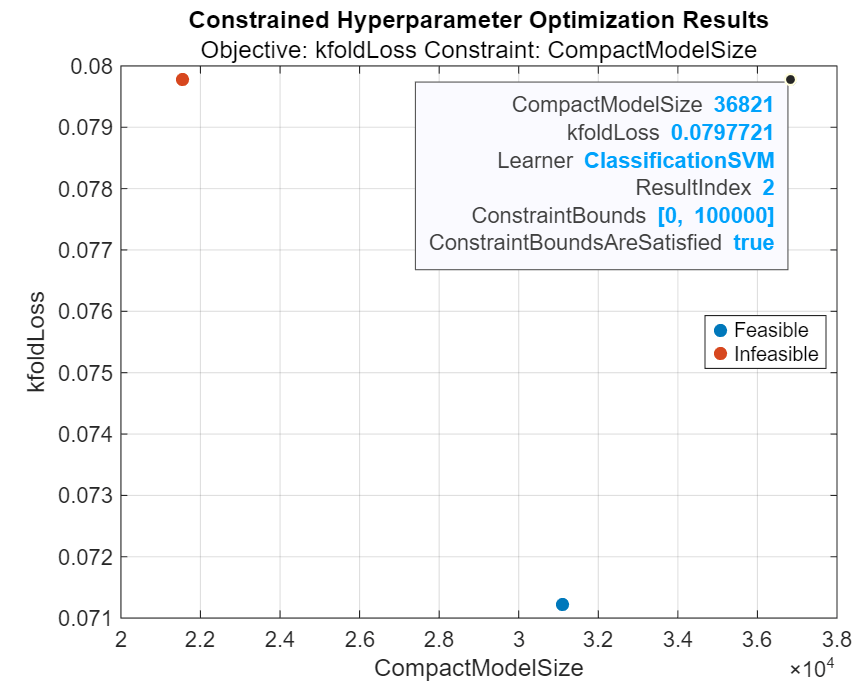
You can point to a plot marker to display a data tip that includes its x-axis and y-axis values, along with other parameters of the optimization problem.
Input Arguments
Output Arguments
Version History
Introduced in R2024b