Detect Valid Transmission Data by Using Frame Synchronization
This example shows how to process complex data in a Stateflow® chart. The model uses vectors of complex data to find a fixed pattern in a signal from a communication system.
Frame Synchronization
In communication systems, frame synchronization is a method of finding valid data in a transmission that consists of data frames. To aid frame synchronization, the transmitter inserts a fixed data pattern at the start of each data frame to mark the start of valid data. The receiver searches for the fixed pattern and achieves frame synchronization when the correlation between the input data and the fixed pattern is high.
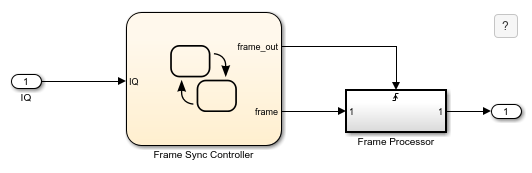
In this example, the Stateflow chart Frame Sync Controller accepts a complex input signal IQ and searches for the fixed data pattern trainSig. After recognizing the start of a data frame, the chart stores the valid data in a complex output signal frame. This output signal is a vector of complex products between each valid data point and the phase angle of the carrier wave. The chart then passes the valid data to the Frame Processor subsystem.
Note that this model does not contain the rest of the communication system.
Synchronize Data Frame
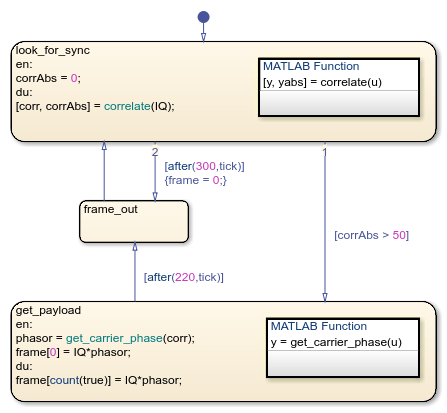
In the Frame Sync Controller chart, the look_for_sync state starts the frame synchronization algorithm. At each time step, the MATLAB® function correlate calculates the correlation between the input signal IQ and the fixed data pattern trainSig. The function stores the complex correlation as corr and its absolute value as corrAbs. The value of corrAbs is the correlation percentage, which can range from 0 to 100 percent. At 0 percent, there is no correlation. At 100 percent, there is perfect correlation.
If
corrAbsexceeds 50 percent, the correlation is high and the chart registers the start of a data frame. The chart takes the transition to theget_payloadstate and stores 220 valid data points in the complex vectorframe.If
corrAbsstays below 50 percent for 300 consecutive data points, the frame synchronization algorithm resets. The chart takes the transition to theframe_outstate and triggers the Frame Processor subsystem. The chart then returns to thelook_for_syncstate.
Store Scalar Data in a Vector
When the Frame Sync Controller chart recognizes the start of a data frame, the get_payload state calls the MATLAB function get_carrier_phase to compute the phase angle of the carrier wave. The state stores this phase angle as the local data object phasor. Then the state collects the scalar values of the product of IQ*phasor in the vector frame. To avoid using an extra variable as an index counter, this state indexes into this vector by using the count operator:
When the state becomes active, the
entryaction stores the initial value of the product in the first element offrame.In later time steps, the
duringaction stores the next values of this product in successive elements offrame. The indexing expressioncount(true)returns the number of time steps since the state became active.
After 220 times steps, the transition condition [after(220,tick)] becomes true and the chart exits from the state. When the chart enters the frame_out state, the vector frame contains the values of 220 products. The chart passes this data to the Frame Processor subsystem and then returns to the look_for_sync state.