Characterize Battery Cell for Electric Vehicles
This example shows how to characterize a battery cell for electric vehicle applications using the test method from [1]. This example estimates the parameters of BAK N18650CL-29 18650 type lithium-ion cells [2] at five different ambient temperatures. The battery hybrid pulse power characterization (HPPC) test is performed in controlled environmental chambers.
Battery Testing
A typical HPPC data is a set of discharge-charge pulses, applied to a battery at different state of charge (SOC) and at a given temperature [1]. The magnitude of the pulse depends on the cell capacity and the test temperature. At the end of every sequence of discharge-charge pulse operations, the SOC decreases by about 10% by applying a constant discharge current of C/3. A long rest time of one hour is recommended for the cells to relax after every sequence of discharge-charge pulses. This process continues until it covers all points of interest in the SOC range. For more information, see [1].
Plot Battery Test Data
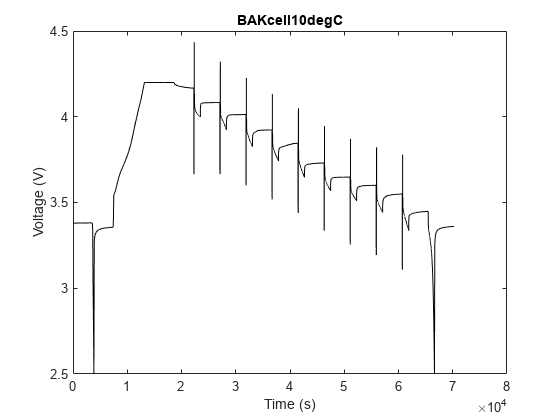
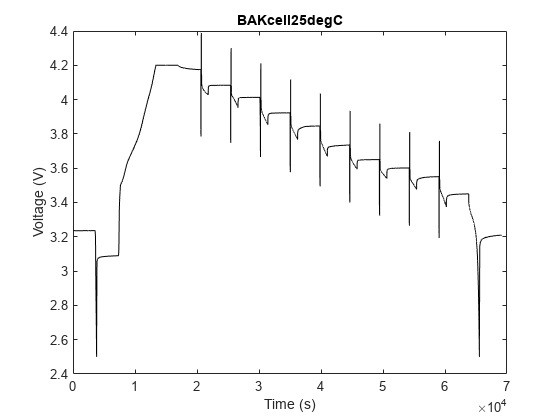
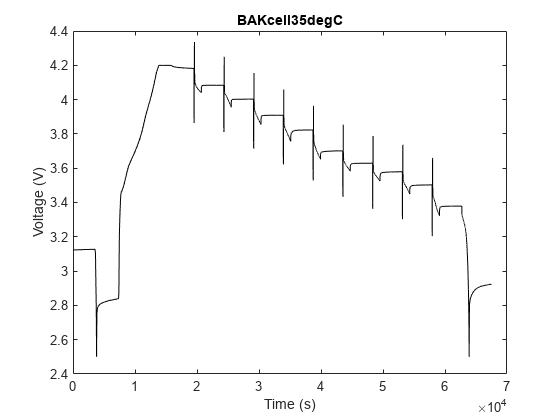
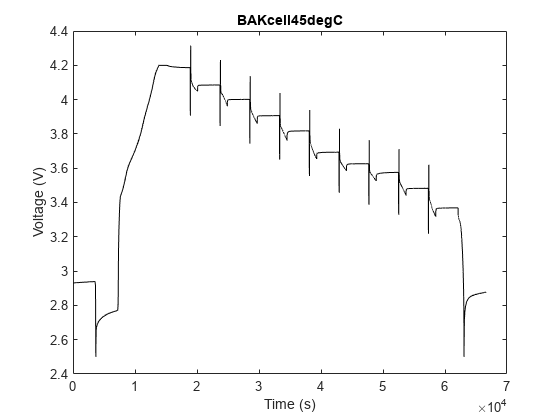
A Biologic BCS-815 8-channel battery tester, equipped with standard cables, accessories, and thermocouples, performed the battery HPPC tests [3]. The test chamber maintained temperature and humidity control. To measure the temperature, the tester used the Agilent 34972A data acquisition system equipped with multiplexer capabilities (34901A 20-Channel Multiplexer). The system tested three different samples. The test was reproducible each time. The cells were tested at five different temperatures: and chamber temperatures. During the test duration, the temperature was uniform. For more information about the test procedure, see [1].
These plots show the battery test data. Each test data comprises nine pair of discharge-charge pulses. After each discharge-charge operation, a C/3 constant current (SOC sweep step) decreases the cell SOC by 10%. To read, visualize, and extract individual pulse information from the HPPC test data, use the hppcTest function.
TestTemperatures = [0 10 25 35 45];
testData = struct();

for tempIdx = 1:5
    filename = strcat("hppcDataBAKcell",mat2str(TestTemperatures(tempIdx)),"degC");
    loadFileName = fullfile("testDataBAKcells",filename);
    load(loadFileName)
    testData.(filename) = hppcTest(hppcData,TimeVariable="time (s)",...
        VoltageVariable="voltage (V)",CurrentVariable="current (A)",...
        ValidVoltageRange=[2.8 4.6]);
    figure
    plot(testData.(filename))
    title(filename)
end

The hppcTest function automatically reads the HPPC test data and identifies all the individual load pulses. This function returns an HPPCTest object that can automatically perform parameter estimation for battery equivalent circuit models. To further refine the pulses you want to filter, tabulate, and include in the parameter estimation process, define these properties:
CurrentOnThreshold— Threshold current value that indicates whether a charge or a discharge is taking place, specified as a scalar double.VoltageChangeThreshold— Threshold voltage change value that indicates whether a charge or a discharge is taking place, specified as a scalar double.ValidPulseDurationRange— Valid pulse duration range that indicates whether a pulse is valid and should be stored in theTestSummaryproperty table, specified as a1-by-2 vector of doubles.ValidVoltageRange— Valid battery voltage range that indicates whether a pulse is valid and should be stored in theTestSummaryproperty table, specified as a1-by-2vector of doubles.
To view a tabulated summary of the final identified pulses, access the TestSummary property of any of the HPPCTest objects you previously created.
disp(testData.hppcDataBAKcell25degC.TestSummary)
    PulseID    Directionality      SOC          HPPCData         PulseDuration    PseudoOCV_V    MaximumVoltage    MinimumVoltage    Current_A    C_rate    PulseStartIndex    PulseEndIndex    Temperature_degC
    _______    ______________    _______    _________________    _____________    ___________    ______________    ______________    _________    ______    _______________    _____________    ________________

       1        "Discharge"            1    {701×6 timetable}         30            4.1745           4.1745            3.7846         -6.1869     1.8976           354              1055               25
       2        "Discharge"      0.90376    {701×6 timetable}         30            4.0837           4.0837            3.7479          -6.187     1.8977          2702              3403               25
       3        "Discharge"      0.80754    {702×6 timetable}         30            4.0132           4.0132            3.6652         -6.1867     1.8975          5049              5751               25
       4        "Discharge"      0.71133    {701×6 timetable}         30            3.9226           3.9226            3.5775         -6.1868     1.8976          7398              8099               25
       5        "Discharge"      0.61512    {701×6 timetable}         30             3.846            3.846            3.4942         -6.1868     1.8976          9746             10447               25
       6        "Discharge"      0.51891    {701×6 timetable}         30            3.7353           3.7353            3.4001         -6.1871     1.8977         12094             12795               25
       7        "Discharge"       0.4227    {701×6 timetable}         30              3.65             3.65            3.3236         -6.1867     1.8975         14442             15143               25
       8        "Discharge"      0.32649    {701×6 timetable}         30            3.6015           3.6015            3.2652         -6.1869     1.8976         16790             17491               25
       9        "Discharge"      0.23028    {701×6 timetable}         30            3.5507           3.5507            3.1931         -6.1869     1.8976         19138             19839               25
      10        "Charge"         0.98415    {502×6 timetable}         10            4.1158           4.3889            4.1158          4.6393      1.423          1055              1557               25
      11        "Charge"         0.88793    {502×6 timetable}         10             4.057           4.3001             4.057          4.6406     1.4233          3403              3905               25
      12        "Charge"         0.79172    {502×6 timetable}         10            3.9674           4.2113            3.9674          4.6394      1.423          5751              6253               25
      13        "Charge"         0.69551    {502×6 timetable}         10            3.8751           4.1175            3.8751          4.6396      1.423          8099              8601               25
      14        "Charge"          0.5993    {502×6 timetable}         10            3.7905           4.0355            3.7905          4.6396      1.423         10447             10949               25
      15        "Charge"         0.50309    {502×6 timetable}         10            3.6936           3.9339            3.6936          4.6405     1.4233         12795             13297               25
      16        "Charge"         0.40688    {502×6 timetable}         10            3.6224           3.8602            3.6224          4.6396      1.423         15143             15645               25
      17        "Charge"         0.31066    {502×6 timetable}         10            3.5695           3.8109            3.5695          4.6397     1.4231         17491             17993               25
      18        "Charge"         0.21445    {502×6 timetable}         10            3.5098           3.7597            3.5098          4.6397     1.4231         19839             20341               25
Estimate Battery Parameters
The Battery Equivalent Circuit block in Simscape Battery uses the equivalent circuit modeling approach. You can capture different physical phenomena of a cell by connecting multiple resistor-capacitor (RC) pairs in series. In the Battery Equivalent Circuit block, you can select up to three RC pairs. You can derive the value of the resistance and time constant parameters from the HPPC test data.
This equation defines the voltage response of a battery cell,
where:
is the cell open-circuit potential.
is the cell ohmic resistance.
and are the cell i-th RC pair resistance and time constant values.
is the current passing through the cell.
t is the elapsed time.
All parameters in this equation can be a function of the SOC, current load, current directionality, and cell temperature. Some HPPC test standards apply the current load such that the battery SOC and temperature states do not vary significantly. Therefore, you can assume a constant temperature. This figure shows a typical discharge-charge profile used in the test standard [1].
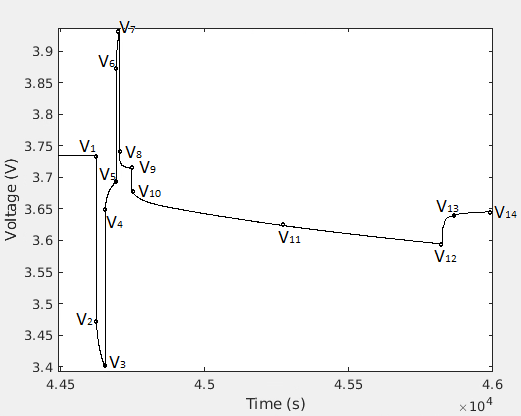
You can estimate the ohmic resistance from the sudden voltage change at the start of a discharge or a charge pulse (for example V1 to V2 or V5 to V6). To estimate the and parameters, you can use the short voltage relaxation immediately after the discharge (V4 - V5) or the charge (V8 - V9) pulse. You can extract more time constants from the longer voltage relaxation (V12 - V14) after the SOC sweep step (V9 - V12). In this example, you use the fitecm function to estimate the , , and parameters for the battery.
Select Parameter Estimation Method
The process of parameter estimation involves minimizing the error between the predicted voltage output of the ECM and the measured battery voltage response from the HPPC test. This table shows the most typical ECMs used to represent the impedance of a battery.
To minimize the error, you iteratively adjust the model parameters, such as R0, R1, and C1, until you achieve a satisfactory error between the measured voltage and simulated voltage. There are several techniques in MATLAB® that provide this functionality inside the Model-Based Calibration Toolbox™, System Identification Toolbox™, and Curve Fitting Toolbox™. In this example, you estimate the parameters of the battery model by using an optimization-based fitting method implemented in Simscape™ Battery™. This fitting method utilizes a custom implementation of the fminsearch function.
The battery ECM parameters for a specific operating point can be different depending on which segment or section of the current pulse you use for the parameter estimation process. The load-segment parameters suit most applications. However, the best estimation segment depends on the specific end application of the battery ECM. Some methods are better suited to estimate parameters for a given segment. For example the System Identification Toolbox tfest function works best for fitting load-only dynamics. This table contains a summary of the supported options for the FittingMethod and SegmentToFit arguments of the fitecm function, depending on the chosen toolbox or method. Curve Fitting Toolbox contains good methods to estimate parameters for the relaxation segment.
Estimate Time Constants from Short Relaxation
The testData structure contains information for the pulse section and the short voltage relaxation sections. For the short-duration voltage relaxation segments and load segments, there might not be enough information to fit the time constants of the RC branches that are much greater than 10 seconds. In these cases, to perform the parameter estimation, select a 1-RC equivalent circuit. To estimate the time constants from the short relaxation segment after the pulse, use the fitecm function and specify "relaxation" for the SegmentToFit argument and a 1RC ECM for the ECM argument.
batteryEcm25degC = fitECM(testData.hppcDataBAKcell25degC,ECM=ecm(1),SegmentToFit="relaxation"); To visually verify the fit for the four first pulses, use the plot method. The time constants for the relaxation segment do not necessarily provide good fits for the load segment of the pulse. Other factors, such as the assumption of a scalar constant open-circuit voltage value, might influence the accuracy of the fit in these plots. The crucial output to verify with these plots is that the relaxation behavior matches between simulated and measured voltage points.
plot(batteryEcm25degC,1:4)
To view the time constant values, access the ParameterSummary property of the batteryEcm25degC object.
disp(batteryEcm25degC.ParameterSummary)
    ID    Directionality      SOC      Temperature_degC    Current_A    OpenCircuitVoltage       R0          R1         Tau1       C1        FitPc
    __    ______________    _______    ________________    _________    __________________    ________    _________    ______    ______    __________

     1     "Discharge"            1           25            -6.1869           4.1745          0.043854    0.0098299    10.217    1039.4     0.0026152
     2     "Discharge"      0.90376           25             -6.187           4.0837          0.040707    0.0094222    10.262    1089.2     0.0021524
     3     "Discharge"      0.80754           25            -6.1867           4.0132          0.039485    0.0097654    11.243    1151.3     0.0019493
     4     "Discharge"      0.71133           25            -6.1868           3.9226          0.039243    0.0094014    11.678    1242.1     0.0017278
     5     "Discharge"      0.61512           25            -6.1868            3.846           0.03937    0.0090181    11.633    1289.9     0.0016414
     6     "Discharge"      0.51891           25            -6.1871           3.7353          0.039686    0.0081095    11.185    1379.2     0.0014102
     7     "Discharge"       0.4227           25            -6.1867             3.65          0.040354    0.0083378    11.252    1349.6     0.0013838
     8     "Discharge"      0.32649           25            -6.1869           3.6015           0.04115    0.0085245    11.562    1356.4     0.0013272
     9     "Discharge"      0.23028           25            -6.1869           3.5507          0.042858    0.0086828    11.024    1269.6       0.00164
    10     "Charge"         0.98415           25             4.6393           4.1158            0.0482    0.0052075    3.8168    732.95    0.00053578
    11     "Charge"         0.88793           25             4.6406            4.057          0.043691    0.0043709    4.3715    1000.1     0.0003732
    12     "Charge"         0.79172           25             4.6394           3.9674          0.042342    0.0045548    4.3033    944.79    0.00035176
    13     "Charge"         0.69551           25             4.6396           3.8751           0.04209     0.004625    4.1394       895    0.00032855
    14     "Charge"          0.5993           25             4.6396           3.7905          0.042434    0.0047765    3.8075    797.13    0.00034043
    15     "Charge"         0.50309           25             4.6405           3.6936          0.043065     0.004334    4.1386    954.92    0.00049142
    16     "Charge"         0.40688           25             4.6396           3.6224          0.043463    0.0039566     4.798    1212.7    0.00033171
    17     "Charge"         0.31066           25             4.6397           3.5695          0.044009    0.0038565    4.7506    1231.8    0.00029811
    18     "Charge"         0.21445           25             4.6397           3.5098          0.045168    0.0040985    4.8543    1184.4    0.00032097
EstimateTime Constants from Long Relaxation
To extract the time constants from the longer voltage relaxation pulses, you must first filter the HPPC data using the hppcTest function by defining the ValidPulseDurationRange and the ValidVoltageRange name-value arguments. If you increase the minimum and maximum pulse duration thresholds, you also filter out the shorter duration pulses and you only obtain the SOC sweep pulses with the longer voltage relaxation section.
for tempIdx = 1:5
    filename = strcat("hppcDataBAKcell",mat2str(TestTemperatures(tempIdx)),"degC");
    loadFileName = fullfile("testDataBAKcells",filename);
    load(loadFileName)

    testData.(strcat(filename,"Long")) = hppcTest(hppcData,TimeVariable="time (s)",...
        VoltageVariable="voltage (V)",CurrentVariable="current (A)", ...
    ValidPulseDurationRange=[100 1600],ValidVoltageRange=[3 4.6]);
end
To inspect the individual pulses in the HppcTest object, use the plot method.
figure
plot(testData.hppcDataBAKcell25degCLong)
title("Long relaxation pulses 25degC")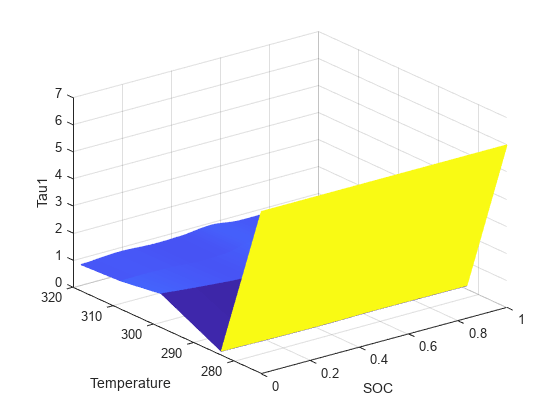
disp(testData.hppcDataBAKcell25degCLong.TestSummary)
    PulseID    Directionality      SOC           HPPCData         PulseDuration    PseudoOCV_V    MaximumVoltage    MinimumVoltage    Current_A    C_rate     PulseStartIndex    PulseEndIndex    Temperature_degC
    _______    ______________    _______    __________________    _____________    ___________    ______________    ______________    _________    _______    _______________    _____________    ________________

       1        "Discharge"      0.98811    {1145×6 timetable}        1081           4.1416           4.1416            4.0285        -0.91589     0.28092          1557              2702               25
       2        "Discharge"      0.89189    {1144×6 timetable}        1081           4.0781           4.0781            3.9534        -0.91593     0.28093          3905              5049               25
       3        "Discharge"      0.79568    {1145×6 timetable}        1081           3.9949           3.9949            3.8544        -0.91594     0.28093          6253              7398               25
       4        "Discharge"      0.69947    {1145×6 timetable}        1081           3.9021           3.9021            3.7672        -0.91597     0.28094          8601              9746               25
       5        "Discharge"      0.60326    {1145×6 timetable}        1081           3.8171           3.8171            3.6693        -0.91604     0.28096         10949             12094               25
       6        "Discharge"      0.50705    {1145×6 timetable}        1081           3.7145           3.7145            3.5944        -0.91599     0.28095         13297             14442               25
       7        "Discharge"      0.41084    {1145×6 timetable}        1081           3.6413           3.6413            3.5392        -0.91597     0.28094         15645             16790               25
       8        "Discharge"      0.31462    {1145×6 timetable}        1081             3.59             3.59             3.476        -0.91584      0.2809         17993             19138               25
       9        "Discharge"      0.21841    {1148×6 timetable}        1082           3.5324           3.5324            3.3742        -0.91575     0.28087         20341             21489               25
To estimate the time constants from the long relaxation segment after the SOC sweep pulse, use the fitecm function.
batteryEcm25degCLong = fitECM(testData.hppcDataBAKcell25degCLong, SegmentToFit = "relaxation"); To view the time constant values, use the ParameterSummary property of the batteryEcm25degCLong object. These time constants might not produce a good fit for the load segment of the pulse.
disp(batteryEcm25degCLong.ParameterSummary)
    ID    Directionality      SOC      Temperature_degC    Current_A    OpenCircuitVoltage       R0           R1           Tau1           C1           R2         Tau2       C2        FitPc
    __    ______________    _______    ________________    _________    __________________    ________    __________    __________    __________    _________    ______    ______    __________

    1      "Discharge"      0.98811           25           -0.91589           4.1416          0.037254      0.016552        3.3039         199.6    0.0061691    254.79     41301    3.7102e-06
    2      "Discharge"      0.89189           25           -0.91593           4.0781          0.035967      0.019408    1.0001e-10    5.1529e-09    0.0088514     42.43    4793.6    5.0498e-05
    3      "Discharge"      0.79568           25           -0.91594           3.9949          0.035675      0.027497        40.294        1465.4     0.011182    338.03     30229    2.6218e-06
    4      "Discharge"      0.69947           25           -0.91597           3.9021          0.035987    1.6543e-05    1.1726e-10    7.0885e-06     0.045121    37.133    822.97     0.0019725
    5      "Discharge"      0.60326           25           -0.91604           3.8171          0.036338         1e-05    0.00017667        17.667     0.030543    27.427    897.97    0.00082185
    6      "Discharge"      0.50705           25           -0.91599           3.7145          0.037034         1e-05    4.4858e-07      0.044858      0.02241    34.556      1542    7.1771e-05
    7      "Discharge"      0.41084           25           -0.91597           3.6413          0.037719      0.019914    1.0003e-10    5.0229e-09    0.0082379    35.722    4336.4    0.00033233
    8      "Discharge"      0.31462           25           -0.91584             3.59          0.038465      0.018573        1.4823        79.809     0.030163    719.11     23841    2.0817e-05
    9      "Discharge"      0.21841           25           -0.91575           3.5324          0.040896      0.024498          49.1        2004.3     0.021757    721.75     33173    7.0132e-06
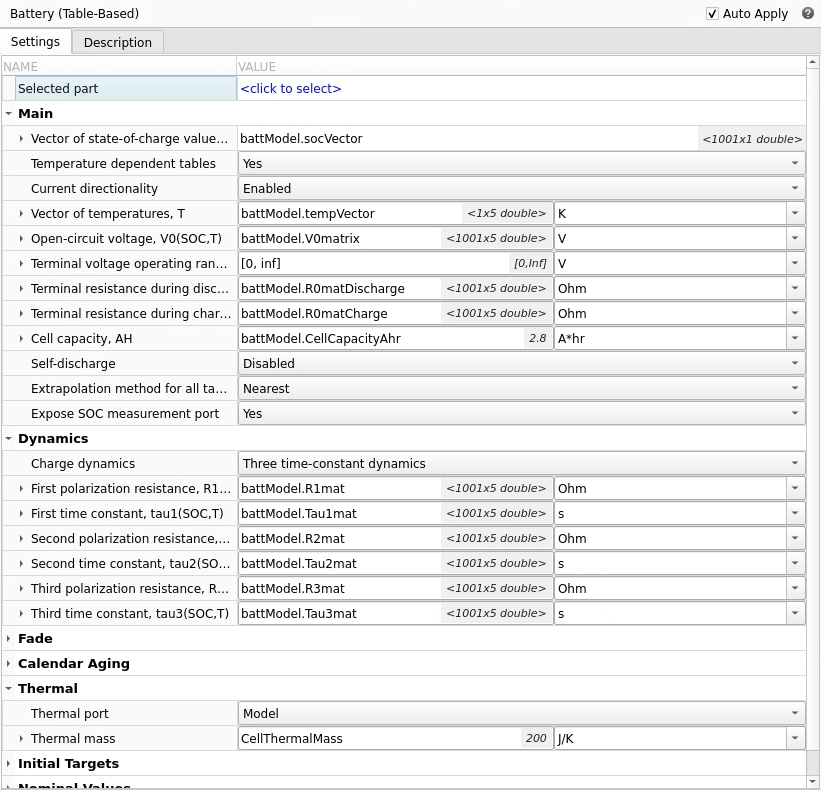
Parameterize Battery Equivalent Circuit Block
To parameterize the Battery Equivalent Circuit block and visualize the verification results for all the temperatures that you specified in the TestTemperatures workspace variable, at the MATLAB Command Window, enter:
hppcSuite = hppcTestSuite([testData.hppcDataBAKcell0degC,...
    testData.hppcDataBAKcell10degC,...
    testData.hppcDataBAKcell25degC,...
    testData.hppcDataBAKcell35degC,...
    testData.hppcDataBAKcell45degC], ...
    Temperature=TestTemperatures);

batteryEcm = fitECM(hppcSuite,SegmentToFit="loadAndRelaxation");
You can also parameterize the equivalent circuit model by selecting either the "relaxation" or "load" segment of the pulse. In addition, you can also decide to fit the model using the long voltage relaxation pulses instead.
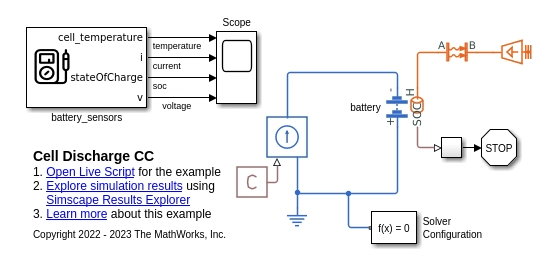
To parameterize the Battery Equivalent Circuit block, open the CellDischargeCC model and obtain the handle to the Battery Equivalent Circuit block.
modelName = "CellDischargeCC";
open_system(modelName);
blockHandle = getSimulinkBlockHandle( strcat(modelName,"/battery"));
Use the parameterizeEquivalentCircuitBlock function and close the model.
batteryEcm.ResistanceTemperatureBreakpoints = simscape.Value([10,25,35,45] + 273.15,"K");
parameterizeEquivalentCircuitBlock(batteryEcm,blockHandle,"ParameterizePseudoOCV",false)
close_system(modelName,1)
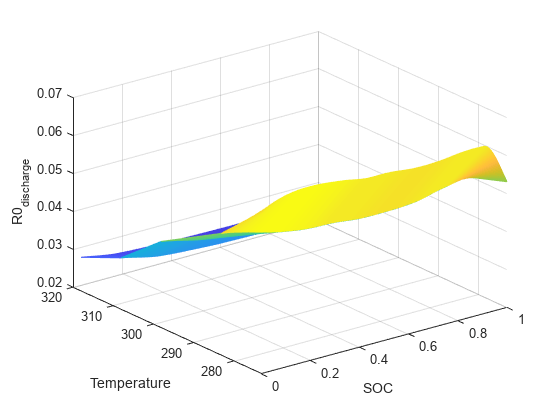
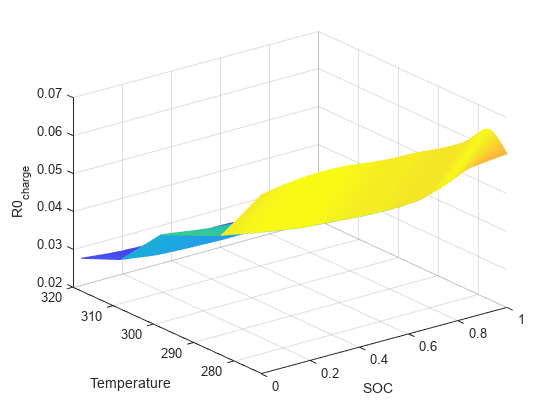
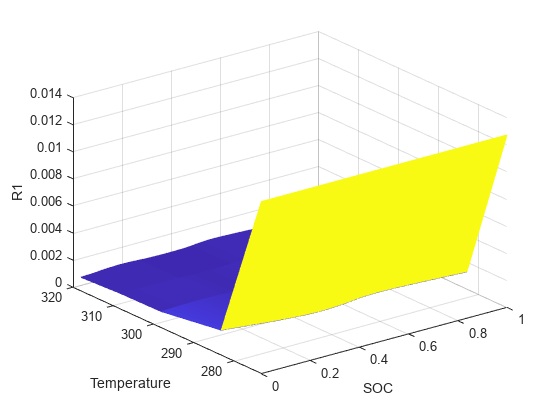
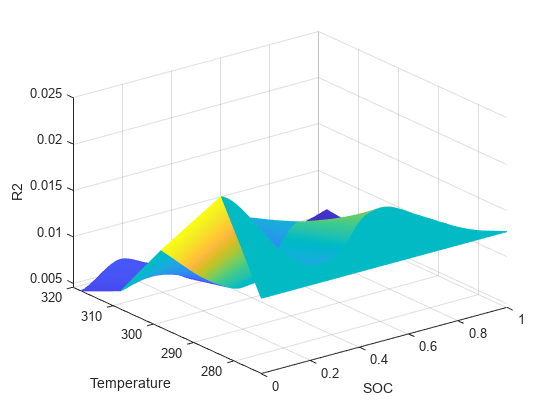
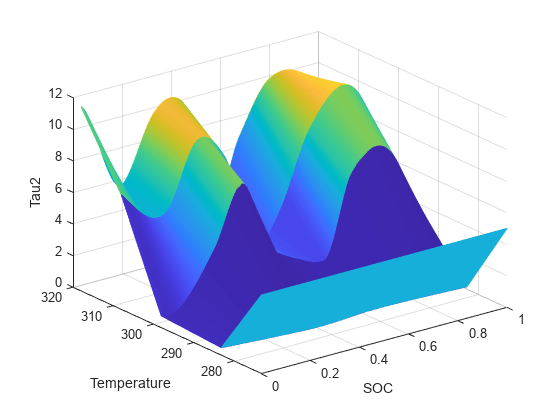
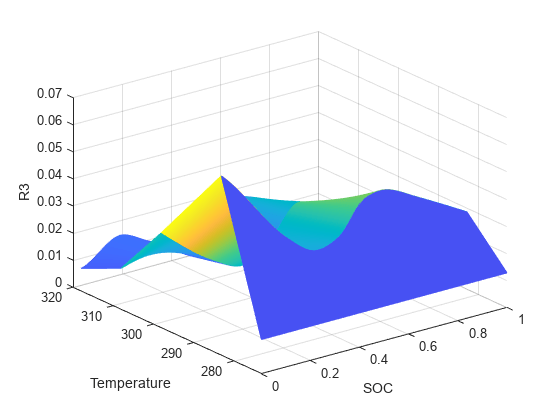
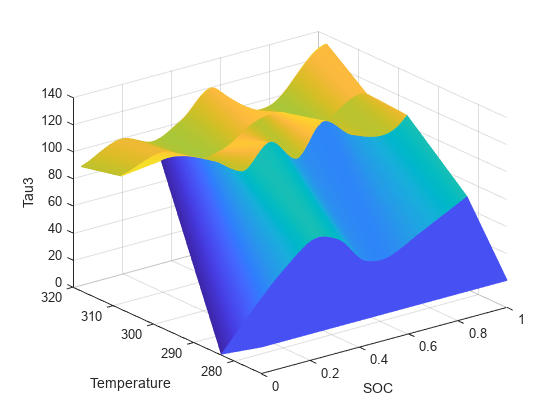
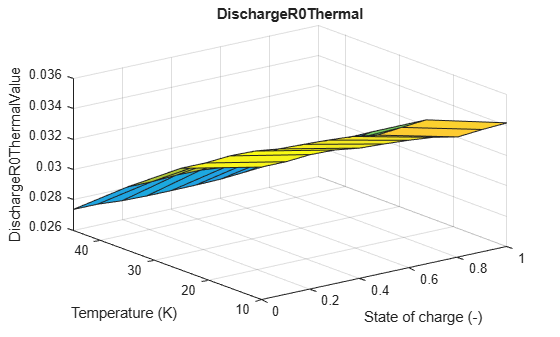
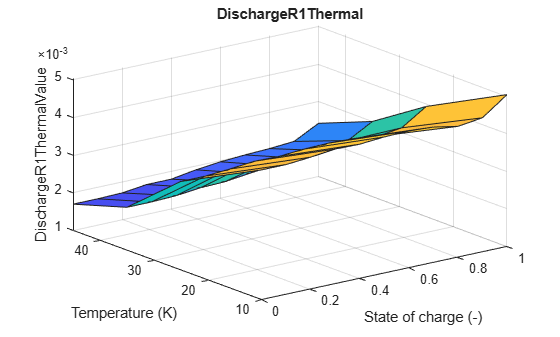
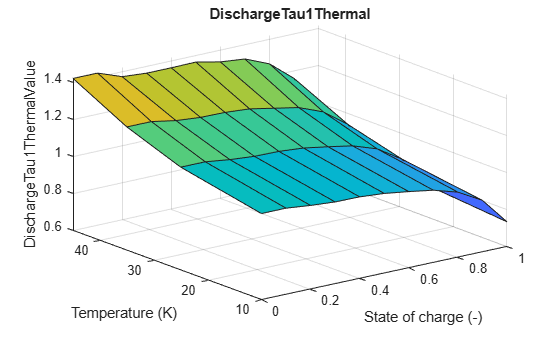
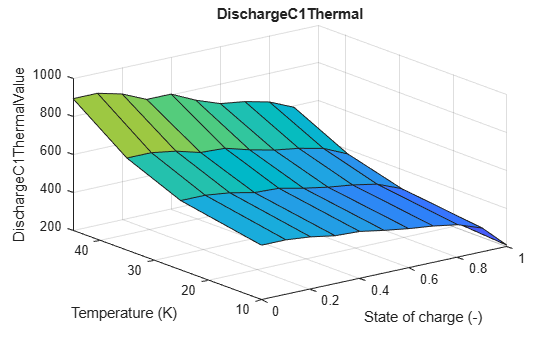
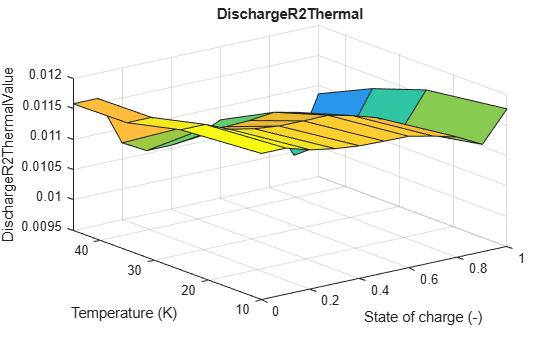
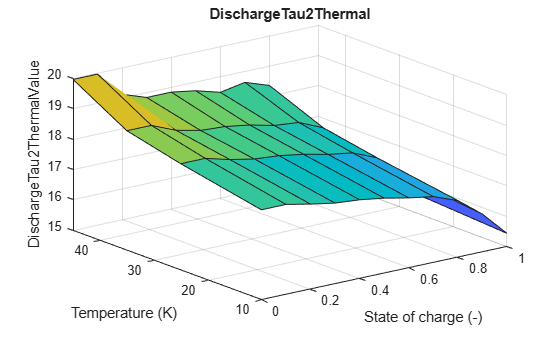
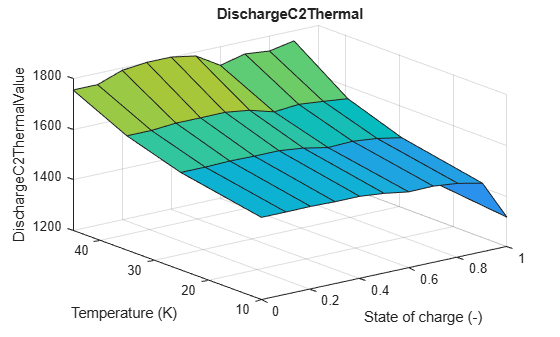
To visualize the parameter trends, use the plotModelParameters method of the batteryEcm object.
plotModelParameters(batteryEcm)


Simulate Battery with Estimated Parameters
This figure shows the CellDischargeCC model.
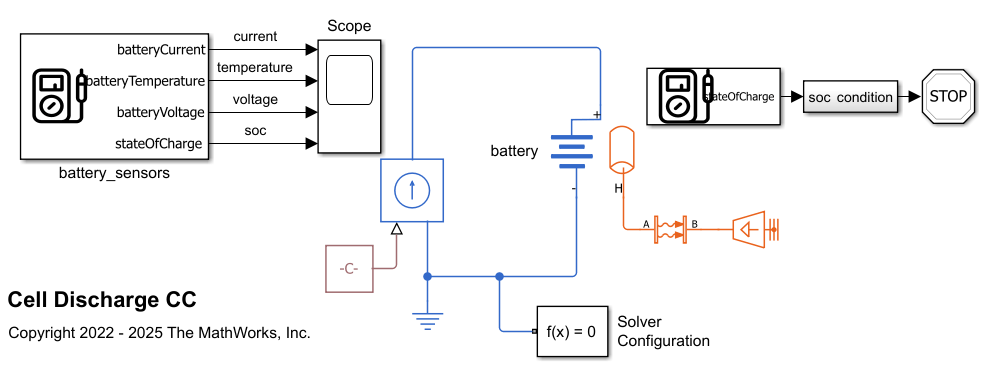
Set the minimum and the maximum C-rates for the simulation.
oneHr = 3600;
C_rate_min = 0.25;
C_rate_max = 1;
C_rate_del = 0.25;
numCases = (C_rate_max - C_rate_min)/C_rate_del + 1;
Set the battery capacity, thermal mass, initial temperature, and initial SOC. The temperature of the cell depends on the CellThermalMass, which is equal to 200 J/K.
CellCapacityAhr = 2.8;
CellThermalMass = 200;
InitialTemperature = 305;
InitialSOC = 1;
load("ocvData.mat")
Run a constant current discharge at different C rates, for a given InitialTemperature.
legendStr = strings(1,numCases);
battSensorData = cell(1,numCases);
Run all simulations.
caseNum = 0;
for C_rate = C_rate_min:C_rate_del:C_rate_max
    caseNum = caseNum + 1;
    legendStr(1,caseNum) = strcat(num2str(C_rate),'C rate discharge case');
    BatteryConstantCurrent = -C_rate*CellCapacityAhr;
    batterySimTime_s = oneHr/C_rate;
    sim('CellDischargeCC');
    ts      = simlog_CellDischargeCC.battery.batteryVoltage.series.time;
    voltage = simlog_CellDischargeCC.battery.batteryVoltage.series.values;
    tempK   = simlog_CellDischargeCC.battery.batteryTemperature.series.values;
    battSensorData{1,caseNum} = [ts voltage tempK];
end
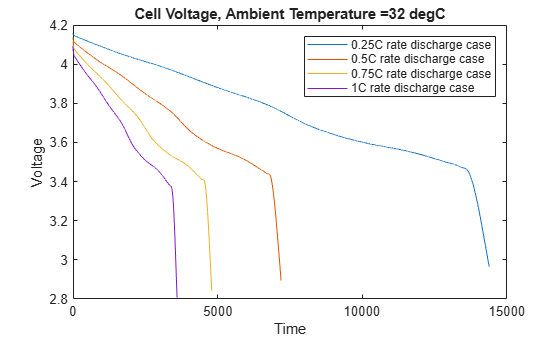
Plot the battery voltage for different constant current discharge cases.
titleDisplay = strcat('Cell Voltage, Ambient Temperature = ',num2str(InitialTemperature-273),' degC');
figure('Name', titleDisplay);
for itr = 1:numCases
    plot(battSensorData{1,itr}(:,1),battSensorData{1,itr}(:,2)); hold on
end
hold off
legend(legendStr);
xlabel('Time');
ylabel('Voltage');
title(titleDisplay);
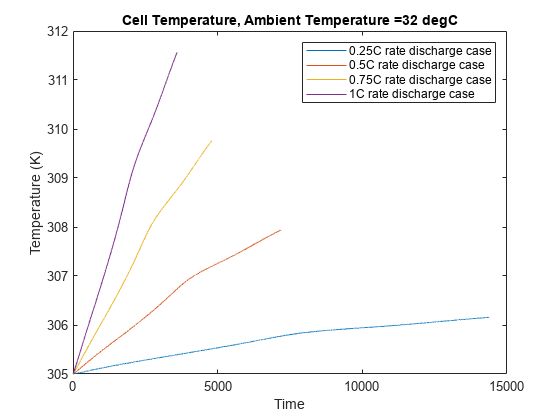
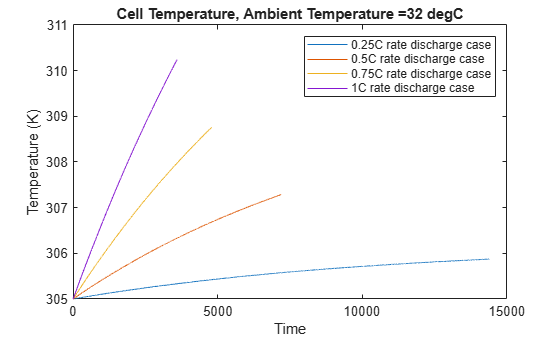
Plot the battery temperature rise during the constant current discharge cases.
titleDisplay = strcat('Cell Temperature, Ambient Temperature = ',num2str(InitialTemperature-273),' degC');
figure('Name', titleDisplay);
for itr = 1:numCases
    plot(battSensorData{1,itr}(:,1),battSensorData{1,itr}(:,3)); hold on
end
hold off
legend(legendStr);
xlabel('Time');
ylabel('Temperature (K)');
title(titleDisplay);
References
Christophersen, Jon P. "Battery Test Manual For Electric Vehicles, Revision 3". United States: N. p., 2015. Web. doi:10.2172/1186745
Zhengzhou Bak Battery Co.,LTD, "Specification For Lithium-ion Rechargeable Cell. Cell Type : N18650CL-29".
Anandaroop Bhattacharya, Subhasish Basu Majumder. "Experimental data collected with Biologic BCS-815 8-channel battery tester for battery HPPC test". Indian Institute of Technology (IIT) Kharagpur, India.