Dynamic Scheduling of Discrete-Event Chart Block
This example shows how to use the dynamic scheduling that the Discrete-Event Chart block provides. A Discrete Event Chart block can execute zero or multiple times in a time step. The example compares the behaviors of the Discrete-Event Chart and Stateflow® Chart blocks. Both blocks require a Stateflow® license.
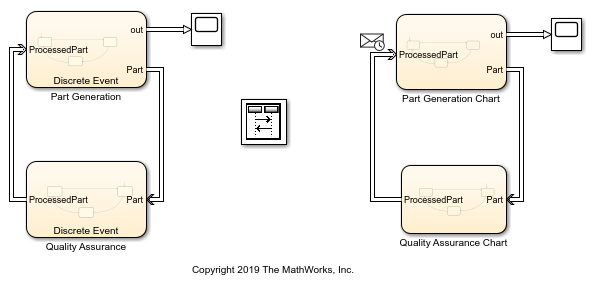
In this example, a bicycle part is generated every second by the Part Generation block. Its quality control is simultaneously performed when the part is in the assembly line. The quality control process takes 1 s to restart. This process is modeled by the Quality Assurance block.
The solver is set to Fixed-step with step size 1, and for all the Stateflow® Chart blocks, the Enable Super Step Semantics option is selected. For more information, see Super Step Semantics (Stateflow).
Model Description
In the model, Part Generation is modeled by a Discrete-Event Chart block and Part Generation Chart is modeled by a Stateflow® Chart block. Both blocks contain the same state transition logic including three states, CreatePart, WaitForQA, and Ship.

After
1s, a Part is generated and the Chart transitions from theCreateParttoWaitForQA.
The quality control is simultaneous and the
ProcessedPartreturns back immediately. The block transitions to theShipstate and after theProcessedPartis shipped to theCreatePartstate.

Similarly, the Quality Assurance is modeled by a Discrete-Event Chart while the Quality Assurance Chart is modeled by a Stateflow® Chart block. Both blocks contain the same state transition logic including three states, WaitForPart, Evaluating, and Finished.
The
WaitForPartstate represents the wait for the generated Part. When the Part arrives, the block transitions to theEvaluatingstate.
Then the
ProcessedPartis immediately sent back to Part Generation and the block transitions to theFinishedstate.
After
1s, the block returns to theWaitForPartstate.
Simulation Results
Simulate the model. Observe the Scope block connected to the Part Generation block. The Parts depart the facility every second.

Observe the Scope block connected to the Part Generation Chart block, which displays that the parts are generated in every two seconds.

The difference is due to the dynamic scheduling property of the Discrete-Event Chart block. For instance, observe the Sequence Viewer block. Each time grid row, bordered by two blue lines, contains events that occur at the same simulation time. For more information, see Use the Sequence Viewer to Visualize Messages, Events, and Entities.
In the second and third simulation time step, the static scheduling of the Stateflow® Chart blocks causes their execution with a fixed order, in which the Part Generation Chart labeled 1 is executed first and the Quality Assurance Chart labeled 2 is executed second for each time step. The sequence is 1,1,2 for the second time step and 1,2,2 for the third time step.
The dynamic scheduling property of the Discrete-Event Chart allows multiple executions of the Part Generation and Quality Assurance blocks at each time step with the changing order. For example, in the second time step, the order becomes 2,1,2,2,1,1.
