Create Dynamic Tables
A dynamic table is one whose size you do not know before your report generator program runs, so you cannot hard code its size. This example shows two approaches to creating a dynamic table. One approach creates a table from basic table objects. The other approach uses a table constructor that creates a table directly from the input to the constructor.
Create Dynamic Table From Table Objects
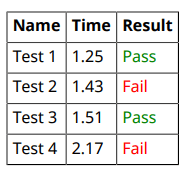
This example shows how to create a table by looping and creating basic table objects: table, table entry, and table row objects. The code displays a table of test results, with the first column being the test name, the second, the test time, and the third, the color-coded result.

import mlreportgen.report.*
import mlreportgen.dom.*

rpt = Report('testResults','pdf');

% Input data
testData = struct('Name',{'Test 1','Test 2',...
    'Test 3','Test 4'},'Time',{1.25,1.43,1.51,2.17},...
    'Result',{'Pass','Fail','Pass','Fail'});

% Row heading names and number of columns
fields = fieldnames(testData);
nFields = numel(fields);

% Table, row, and table entries formatting
table = FormalTable();
table.RowSep = 'Solid';
table.ColSep = 'Solid';
table.Border = 'Solid';
table.TableEntriesInnerMargin = '5px';
table.Header.Style = {Bold()};

% Table heading row
headRow = TableRow();
for k = 1:nFields
    append(headRow,TableEntry(fields{k}));
end
append(table.Header,headRow);

% Table rows and table entries
for data = testData
    row = TableRow();
    for j = 1:nFields
        x = string(data.(fields{j}));
        p = Paragraph(x);
        if x == "Pass"
            p.Color = 'green';
        elseif  x == "Fail"
            p.Color = 'red';
        end
        new_entry = TableEntry(p);
        append(row,new_entry);
    end
    append(table,row);
end
add(rpt,table);

close(rpt);
rptview(rpt);
Create Dynamic Table Using Table Constructor
This program shows how to create a table using the input to the table constructor. The advantage of creating a table this way is that you do not have to build the table by looping through the data to create table entry and row objects. In this example, the input data that specifies the table content is in a cell array. This code displays a the same table of test results as shown in Create Dynamic Table From Table Objects.
The code first determines the number of rows and columns in the cell array and preallocates memory for the table. The code then performs two optional steps that format the table contents — converting the data values to strings to specify the number of decimal places for the data, and looping through the data to set the color of the result column. Finally, it creates a formal table directly from the inputs: the table heading row text and the cell array of table data, and then formats the table.
import mlreportgen.report.*
import mlreportgen.dom.*

rpt = Report('testResults_cell','pdf');

testData_raw = {'Test 1',1.25,'Pass';'Test 2',1.43,...
   'Fail';'Test 3',1.51,'Pass';'Test 4',2.17,'Fail'};

% Obtain cell array size
[nrows,ncols] = size(testData_raw);

% Convert all values to strings to control number of
% decimal places displayed
testData = testData_raw;
idx = cellfun(@isnumeric, testData_raw(:));
testData(idx) = cellfun(@(x){sprintf('%.2f', x)}, testData_raw(idx));

% Set color of results column text items
for i = 1:nrows
    for j = 1:ncols
       d = string(testData(i,j));
       p = Paragraph(d);
       if d == "Pass"
            p.Color = 'green';
       elseif  d == "Fail"
            p.Color = 'red';
       end
       testData(i,j) = {p};
   end
end

% Create and format table
table = FormalTable({'Name','Time','Result'},testData);
table.RowSep = 'Solid';
table.ColSep = 'Solid';
table.Border = 'Solid';
table.TableEntriesInnerMargin = '5px';
table.Header.Style = {Bold()};
add(rpt,table);

close(rpt);
rptview(rpt);
See Also
mlreportgen.report.Report | mlreportgen.dom.FormalTable | mlreportgen.dom.TableEntry | struct | cell