plot
Description
plot( plots
the climate scenario data contained in the cs,Name=Value)climateScenario
object, cs. Select the data for your plot by specifying name-value
arguments for the identifiers. For example,
plot(cs,Region="Canada",Variable="Carbon price") plots the price of
carbon in Canada.
h = plot(
returns a cs,Name=Value)Line object or an array of Line objects. Use
the figure handle h to modify properties of the plot after creating
it.
Examples
Plot climate scenario data contained in a climateScenario object. The climate transition scenario data that this example uses is available from the Bank of Canada and is free of charge at http://www.bankofcanada.ca.
Load the data.
load("BankOfCanadaClimateScenarioData.mat")
data = ClimateTransitionScenarioData;
head(data) k CL_GEOGRAPHY CL_SECTOR CL_VARIABLE CL_UNIT CL_SCENARIO CL_YEAR CL_VALUE
_ ____________ _________ _______________________________ ___________________ ________________________ _______ ________
1 Canada National Carbon price US$2014/tCO2e Baseline (2019 policies) 2020 12.106
2 Canada National Carbon price US$2014/tCO2e Below 2°C immediate 2020 12.106
3 Canada National Emissions | total GHG (scope 1) Million tonnes CO2e Baseline (2019 policies) 2020 781.04
4 Canada National Emissions | total GHG (scope 1) Million tonnes CO2e Below 2°C immediate 2020 781.04
5 Canada National Input price | Coal Index (2014 = 1) Baseline (2019 policies) 2020 1.2875
6 Canada National Input price | Coal Index (2014 = 1) Below 2°C immediate 2020 1.2875
7 Canada National Input price | Crops Index (2014 = 1) Baseline (2019 policies) 2020 1.0031
8 Canada National Input price | Crops Index (2014 = 1) Below 2°C immediate 2020 1.0031
Create a climateScenario object.
cs = climateScenario(data, ... RegionVar="CL_GEOGRAPHY", ... VariableVar="CL_VARIABLE", ... ScenarioVar="CL_SCENARIO", ... YearVar="CL_YEAR", ... ValueVar="CL_VALUE", ... CustomIdentifiers="Sector", ... CustomIdentifierVars="CL_SECTOR", ... UnitVar="CL_UNIT");
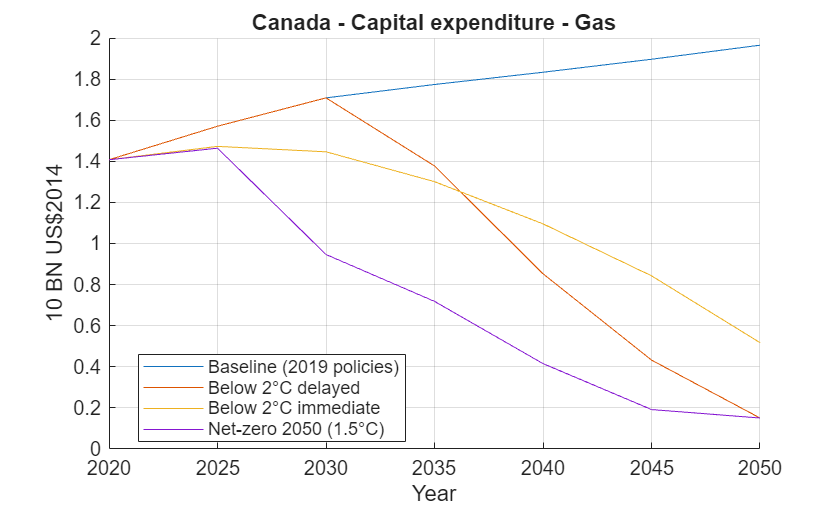
Use plot by specifying the Region and Variable name-value arguments to plot capital expenditure in Canada. Use the custom identifier Sector to limit the plot to the gas sector.
h = plot(cs,Region="Canada",Variable="Capital expenditure",Sector="Gas");

Input Arguments
Climate scenario object, specified as a climateScenario
object.
Name-Value Arguments
Specify optional pairs of arguments as
Name1=Value1,...,NameN=ValueN, where Name is
the argument name and Value is the corresponding value.
Name-value arguments must appear after other arguments, but the order of the
pairs does not matter.
Example: h = plot(cs,Region="Canada",Variable="Capital
expenditure",Sector="Coal") plots capital expenditure for Canada in the coal
sector.
Region identifier values, specified as a string vector. By default, all the
regions are plotted if you do not specify a string vector for
Region.
Variable identifier values, specified as a string vector. By default, all the
variables are plotted if you do not specify a string vector for
Variable.
Scenario identifier values, specified as a string vector. By default, all the
scenarios are plotted if you do not specify a string vector for
Scenario.
Year identifier values, specified as a numeric vector. By default, all the years
are plotted if you do not specify a numeric vector for Year.
Names of custom identifiers, specified as a string vector containing values of
cs.CustomerIndentifiers. CustomIdentifers must
match an identifier property contained in cs.CustomIdentifiers. For
example, if "Sector" is a custom identifier for the property
cs.CustomIdentifier, then h =
plot(cs,Region="Canada",Variable="Capital expenditure",Sector="Coal")
plots capital expenditure for Canada in the coal sector.
Axes object in which to plot. If you do not specify Parent, the
plot function plots on the current Cartesian axes.
Version History
Introduced in R2025a
See Also
climateScenario | query | groupRegions | sumVariables | divideVariables | shockVariables
MATLAB Command
You clicked a link that corresponds to this MATLAB command:
Run the command by entering it in the MATLAB Command Window. Web browsers do not support MATLAB commands.
Website auswählen
Wählen Sie eine Website aus, um übersetzte Inhalte (sofern verfügbar) sowie lokale Veranstaltungen und Angebote anzuzeigen. Auf der Grundlage Ihres Standorts empfehlen wir Ihnen die folgende Auswahl: .
Sie können auch eine Website aus der folgenden Liste auswählen:
So erhalten Sie die bestmögliche Leistung auf der Website
Wählen Sie für die bestmögliche Website-Leistung die Website für China (auf Chinesisch oder Englisch). Andere landesspezifische Websites von MathWorks sind für Besuche von Ihrem Standort aus nicht optimiert.
Amerika
- América Latina (Español)
- Canada (English)
- United States (English)
Europa
- Belgium (English)
- Denmark (English)
- Deutschland (Deutsch)
- España (Español)
- Finland (English)
- France (Français)
- Ireland (English)
- Italia (Italiano)
- Luxembourg (English)
- Netherlands (English)
- Norway (English)
- Österreich (Deutsch)
- Portugal (English)
- Sweden (English)
- Switzerland
- United Kingdom (English)