rfinterp1
Interpolate network parameter data at new frequencies
Syntax
Description
interpData = rfinterp1(netw,newfreq)netw at
the specified frequencies, newfreq. The
rfinterp1 function uses the interp1 to
interpolate each individual (i,j) parameter of
netw to the new frequencies.
Note
If any value of the specified frequency is outside of the
range specified by netw.Frequencies,
then rfinterp1 function inserts
NaNs into
interpData for those frequency
values.
interpData = rfinterp1(netw,newfreq,'extrap')netw.frequencies.
If any of the frequency values in newfreq are
Above the final frequency of the network parameter object,
netw.Frequencies(end), then the function extrapolates flat using the final value of the network parameter datanetw.Parameters(:,:,end).Below the first frequency of the network parameter object,
netw.Frequencies(1), then the function extrapolates linearly betweenconj(netw.Parameters(:,:,1))andnetw.Parameters(:,:,1).
This ensures that the network parameter data of the new
object, interpData.Parameters approach real values
as in newfreq approach
0.
interpData = rfinterp1(netw,newfreq,'rational')netw at the specified frequencies,
newfreq, using the rational object to return high-fidelity interpolation
of the network data.
Note
This function will issue a warning but still interpolate
if the input data does not meet the relative the error
tolerance of the rational object. For
more information, see Tolerance.
(since R2026a)
Examples
Read the data from the file default.s2p into an S-parameter object.
hnet = sparameters("default.s2p");Interpolate the data at a specified set of frequencies.
freq = [1.2:0.2:2.8]*1e9;
hnet2 = rfinterp1(hnet,freq)
hnet2 =
  sparameters with properties:

      Impedance: 50
       NumPorts: 2
     Parameters: [2×2×9 double]
    Frequencies: [9×1 double]
Since R2026a
Create a S-parameter object with the input data.
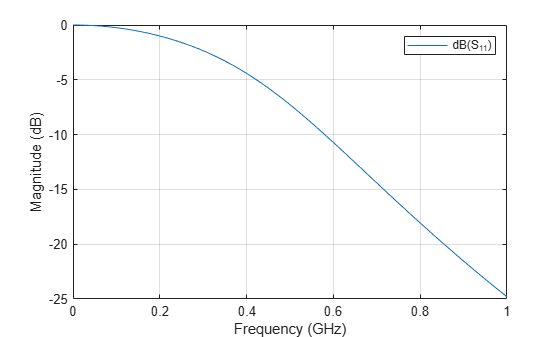
Sint = sparameters('rfinterpdata.s2p');Plot the S-parameter data before interpolation.
rfplot(Sint)
Specify frequencies to interpolate.
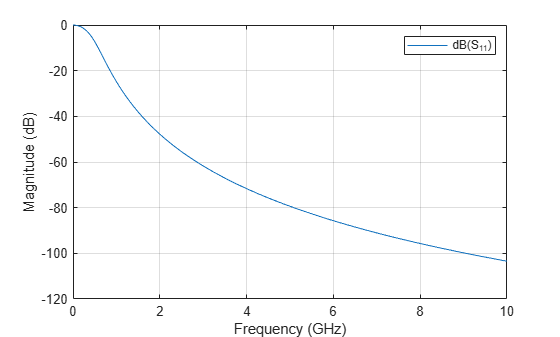
fnew = linspace(0, 1e10, 1823).';
Interpolate the data with the rational fitting algorithm.
interp = rfinterp1(Sint, fnew, 'rational');Plot the interpolated data.
rfplot(interp)
Input Arguments
Output Arguments
Algorithms
The function uses the MATLAB® function interp1 to perform the
interpolation operation. Overall performance is similar to the RF Toolbox
analyze function. However, behaviors of the two functions
differ when freq contains frequencies outside the range
of the original data:
analyzeperforms a zeroth-order extrapolation for out-of-range data points.rfinterp1insertsNaNvalues for out-of-range data points. And also supports interpolation and extrapolation of complex S-parameter data using therationalobject. (since R2026a)