Main Content

clearEvaluationParameter

Delete one or more performance goals

Description

mnobjupdated = clearEvaluationParameter(mnobj,indices) deletes one or more performance goals listed in indices and returns an updated matching network. Use getEvaluationParameters to view performance specifications and find each goal's index.

example

Examples

collapse all

Create a dipole antenna and create the S-parameters of the antenna. This example requires Antenna Toolbox.

d       = dipole('Length', 0.103, 'Width',0.0022);
freq    = linspace(0.5e9,2.5e9,1001);
sd      = sparameters(d, freq);

Alternatively, load S-Parameters from the MAT file

% load('sparams_dipole.mat')

Create a matching network from the S-parameters.

n = matchingnetwork('LoadImpedance',sd,'Components',3,...
    'LoadedQ',7,'CenterFrequency',2e9);

Get the evaluation parameters of the network.

t = getEvaluationParameters(n)
t=1×6 table
    Parameter    Comparison     Goal               Band               Weight       Source    
    _________    __________    ______    _________________________    ______    _____________

     {'Gt'}        {'>'}       {[-3]}    {[1.8571e+09 2.1429e+09]}    {[1]}     {'Automatic'}

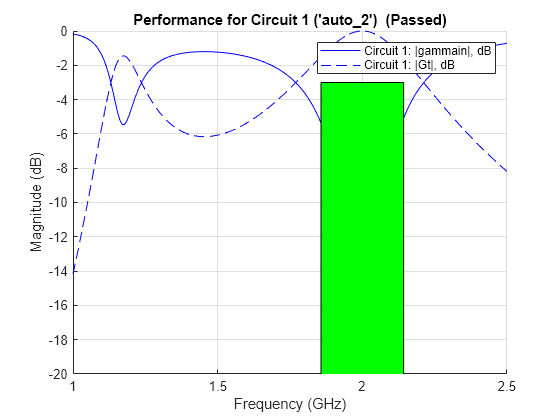
Plot the reflection coefficient and transducer gain of the matching network circuit 1 , at a frequency range of 1 GHz to 2.5 GHz.

rfplot(n, (1e9:0.001e9:2.5e9),1);

Figure Circuit 1 contains an axes object. The axes object with title Performance for Circuit 1 ('auto_2') (Passed), xlabel Frequency (GHz), ylabel Magnitude (dB) contains 3 objects of type line, rectangle. These objects represent Circuit 1: |gammain|, dB, Circuit 1: |Gt|, dB.

Add a new evaluation parameter to compare the transducer gain to have a cut-off of less than -10 dB. Use a frequency range of 0.5 GHz to 1.5 GHz. Plot the comparisons.

n = addEvaluationParameter(n, 'Gt', '<', -10, [0.5e9 1.5e9], 1);
t = getEvaluationParameters(n)
t=2×6 table
    Parameter    Comparison     Goal                Band               Weight          Source      
    _________    __________    _______    _________________________    ______    __________________

     {'Gt'}        {'>'}       {[ -3]}    {[1.8571e+09 2.1429e+09]}    {[1]}     {'Automatic'     }
     {'Gt'}        {'<'}       {[-10]}    {[ 500000000 1.5000e+09]}    {[1]}     {'User-specified'}

rfplot(n, (1e9:0.001e9:2.5e9),1);

Figure Circuit 1 contains an axes object. The axes object with title Performance for Circuit 1 ('auto_8') (Passed), xlabel Frequency (GHz), ylabel Magnitude (dB) contains 4 objects of type line, rectangle. These objects represent Circuit 1: |gammain|, dB, Circuit 1: |Gt|, dB.

Clear evaluation parameters.

n = clearEvaluationParameter(n,1);
t = getEvaluationParameters(n)
t=1×6 table
    Parameter    Comparison     Goal                Band              Weight          Source      
    _________    __________    _______    ________________________    ______    __________________

     {'Gt'}        {'<'}       {[-10]}    {[500000000 1.5000e+09]}    {[1]}     {'User-specified'}

Input Arguments

collapse all

Matching network, specified as a matchingnetwork object.

Data Types: char | string

Indices of the matching network circuit, specified as a list.

Data Types: char | string

Output Arguments

collapse all

Matching network updated according to evaluation parameters, returned as a matchingnetwork object.

Version History

Introduced in R2019a