plotTrack
Plot set of tracks in theater track plotter
Syntax
Description
plotTrack(
also specifies the corresponding velocities of the objects. Velocities are plotted as line
vectors emanating from the positions of the detections. If specified,
tPlotter,positions,velocities)velocities must have the same dimensions as
positions. If unspecified, no velocity information is plotted.
plotTrack(___, also
specifies the covariances of the M track uncertainties. The input
argument covariances)covariances is a 3-by-3-by-M array of
covariances that are centered at the track positions. The uncertainties are plotted as an
ellipsoid. You can use this syntax with any of the previous syntaxes.
plotTrack(
also specifies the labels and positions of the M objects whose positions
are estimated by a tracker. The input argument tPlotter,positions,___,labels)labels is an
M-by-1 cell array of character vectors that correspond to the
M detections specified in positions. If omitted,
no labels are plotted.
plotTrack(
also specifies the unique track identifiers for each track when the tPlotter,positions,___,labels,trackIDs)'ConnectHistory' property of tPlotter is
set to 'on'. The input argument trackIDs can be an
M-by-1 array of unique integer values, an M-by-1
array of strings, or an M-by-1 cell array of unique character
vectors.
If trackIDs is omitted when 'ConnectHistory' is
'on', then the track identifiers are derived from the labels input
instead. The trackIDs input is ignored when
'ConnectHistory' is 'off'.
plotTrack(
specifies the dimension and orientation of each tracked object in the plot.tPlotter,positions,___,dimensions,orientations)
Examples
Create a theater plot. Create a track plotter with DisplayName set to 'Tracks' and with HistoryDepth set to 5.
tp = theaterPlot('XLim',[0,90],'YLim',[-35,35]);
tPlotter = trackPlotter(tp,'DisplayName','Tracks','HistoryDepth',5);

Update the track plotter with three tracks labeled 'T1', 'T2', and 'T3' with start positions in units of meters all starting at (30, 5, 1) with corresponding velocities (in m/s) of (3, 0, 1), (3, 2, 2) and (3, -3, 5), respectively. Update the tracks with the velocities for ten iterations.
positions = [30, 5, 1; 30, 5, 1; 30, 5, 1];
velocities = [3, 0, 1; 3, 2, 2; 3, -3, 5];
labels = {'T1','T2','T3'};
for i=1:10
    plotTrack(tPlotter, positions, velocities, labels)
    positions = positions + velocities;
end

This animation loops through all the generated plots.

Create a theater plot. Create a track plotter with DisplayName set to 'Uncertain Track'.
tp = theaterPlot('Xlim',[0 5],'Ylim',[0 5]);
tPlotter = trackPlotter(tp,'DisplayName','Uncertain Track');
Update the track plotter with a track at a position in meters (2,2,1) and velocity (in meters/second) of (1,1,3). Also create a random 3-by-3 covariance matrix representing track uncertainties. For purposes of reproducibility, set the random seed to the default value.
 positions = [2, 2, 1];
 velocities = [1, 1, 3];
 rng default
 covariances = randn(3,3);
Plot the track with the covariances plotted as an ellipsoid.
plotTrack(tPlotter,positions,velocities,covariances)

Input Arguments
Track plotter, specified as a trackPlotter
object.
Tracked object positions, specified as an M-by-3 real-valued
matrix, where M is the number of objects. Each column of
positions corresponds to the x-,
y-, and z-coordinates of the object locations in
meters.
Tracked object velocities, specified as an M-by-3 real-valued
matrix, where M is the number of objects. Each column of
velocities corresponds to the x,
y, and z velocities of the objects. If
specified, velocities must have the same dimensions as
positions.
Track uncertainties of M tracked objects, specified as a 3-by-3-by-M real-valued array of covariances. The covariances are centered at the track positions, and are plotted as an ellipsoid.
Tracked object labels, specified as a M-by-1 cell array of
character vectors, where M is the number of objects. The argument
labels contains the text labels corresponding to the
M objects specified in positions. If
labels is omitted, no labels are plotted.
Unique track identifiers for the M tracked objects, specified as
an M-by-1 integer vector, an M-by-1 array of
strings, or an M-by-1 cell array of character vectors. The elements
of trackIDs must be unique.
The trackIDs input is ignored when the property ConnectHistory of tPlotter is
'off'. If trackIDs is omitted when
'ConnectHistory' is 'on', then the track
identifiers are derived from the labels input instead.
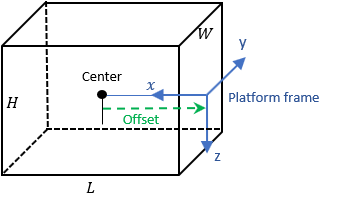
Platform dimensions, specified as an M-by-1 array of dimension structures, where M is the number of platforms. The fields of each dimension structure are:
Fields of Dimensions
| Fields | Description |
|---|---|
Length | Dimension of a cuboid along the x direction |
Width | Dimension of a cuboid along the y direction |
Height | Dimension of a cuboid along the z direction |
OriginOffset | Position of the platform coordinate frame origin with respect to the cuboid center, specified as a vector of three elements |
Platform orientations, specified as a
3-by-3-by-M array of rotation
matrices, or an M-element array of quaternion objects.
Version History
Introduced in R2021a