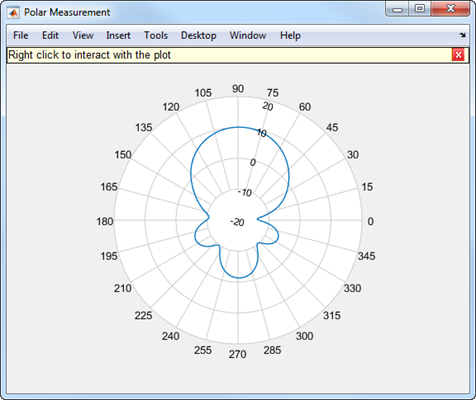
polarpattern
Interactive plot of radiation patterns in polar format
Description
The polarpattern object creates an interactive plot of
antenna or array radiation patterns in polar format with uniformly spaced angles. You
can also plot other types of polar data. Use this plot for interactive data
visualization or measurement. To change the properties, zoom in, or add more data to the
plot, right-click or scroll or drag the Polar Measurement
window.
Creation
Syntax
Description
polarpattern creates an empty polar plot. You can add
plots of antenna or array radiation patterns and other types of data to the
plot by importing saved polari objects from MAT-files.
polarpattern( creates a polar
plot with real magnitude values in the vector data)data with
angles uniformly spaced on the unit circle starting at 0
degrees. Magnitudes may be negative when dB data units are used. For a
matrix data, columns of data are
independent datasets. For N-data
arrays, dimensions 2 and greater are independent datasets. For complex
values, magnitude and angle are derived from data.
polarpattern(___,PropertyName=Value) sets
PolarPattern Properties (Antenna Toolbox) using one or more name–value
arguments. PropertyName is the property name and
Value is the corresponding value. You can specify
several name-value arguments in any order as
PropertyName1=Value1,...,PropertyNameN=ValueN.
Properties that you do not specify, retain their default values. To list all
the property names and values, use details(p). You can
use the properties to extract data about the radiation pattern from the
polar plot.
For example, p = polarpattern(data,Peaks=3) identifies
and displays the three highest peaks in the pattern data.
polarpattern(
creates a polar plot using axes object, ax,___)ax instead of the
current axes object.
p = polarpattern(___)
p = polarpattern('gco')
Input Arguments
Output Arguments
Object Functions
Examples
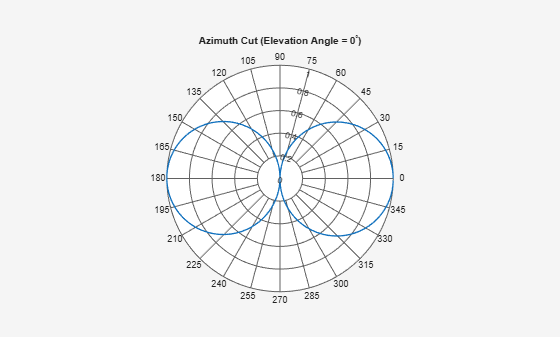
Specify a cosine antenna pattern from 0° to 360° in azimuth at 0° elevation. Then, plot the antenna pattern using polarpattern.
Create the pattern.
az = [0:360];
p = abs(cosd(az));
Plot the polar pattern of the antenna for an azimuth cut at 0° elevation.
polarpattern(p,'TitleTopTextInterpreter','tex','TitleTop','Azimuth Cut (Elevation Angle = 0^{\circ})');
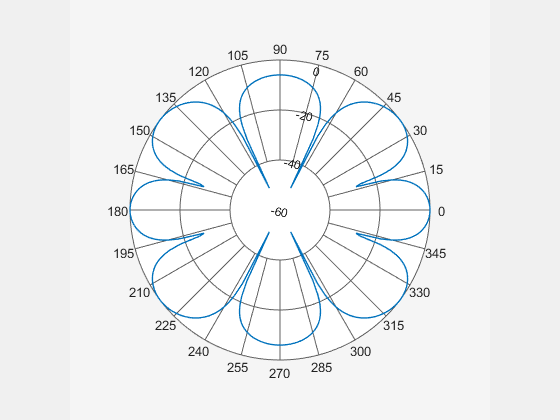
Construct a 3-by-2 rectangular lattice URA. By default, the array consists of isotropic antenna elements. Assume the operating frequency is 1 GHz. Then, plot the antenna pattern using polarpattern.
Create the array.
array = phased.URA('Size',[3 2]);
fc = 1.0e9;
Plot the polar pattern of the array for an elevation cut at 0° azimuth.
c = physconst('LightSpeed');
p = pattern(array,fc,[-180:180],0,'PropagationSpeed',c,'CoordinateSystem',...
    'polar','Type','powerdb','Normalize',true);
polarpattern([-180:180],p);
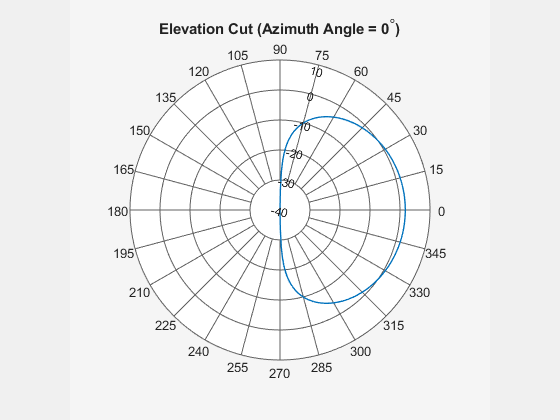
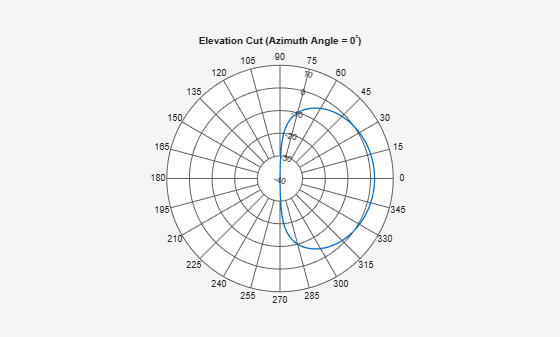
Specify a short-dipole antenna with the dipole oriented along the z-axis and operating at 250 MHz. Then, plot the antenna pattern using polarpattern and specifying a title.
Create the short-dipole antenna element System object™.
antenna = phased.ShortDipoleAntennaElement('FrequencyRange',[100e6,600e6],...
    'AxisDirection','Z');
fc = 250.0e6;
Plot the polar pattern of the antenna for an elevation cut at 0° azimuth.
v = pattern(antenna,fc,0,-90:90);
polarpattern([-90:90],v,'TitleTopTextInterpreter','tex',...
    'TitleTop','Elevation Cut (Azimuth Angle = 0^{\circ})');
Specify a short-dipole antenna with the dipole oriented along the z-axis and operating at 250 MHz. Then, plot the antenna pattern using polarpattern and specifying a title.
Create the short-dipole antenna element System object™.
antenna = phased.ShortDipoleAntennaElement('FrequencyRange',[100e6,600e6],...
    'AxisDirection','Z');
fc = 250.0e6;
Create the polar pattern of the antenna for an elevation cut at 0° azimuth.
p = pattern(antenna,fc,0,-90:90);
P = polarpattern([-90:90],p,'TitleTopTextInterpreter','tex',...
    'TitleTop','Elevation Cut (Azimuth Angle = 0^{\circ})');
Display the properties of the plot.
details(P)
  internal.polari handle with properties:

                      Interactive: 1
                     LegendLabels: ''
                   AntennaMetrics: 0
                        CleanData: 0
                        AngleData: [181×1 double]
                    MagnitudeData: [181×1 double]
                    IntensityData: []
                     AngleMarkers: [0×1 struct]
                    CursorMarkers: [0×1 struct]
                      PeakMarkers: [0×1 struct]
                    ActiveDataset: 1
                  AngleLimVisible: 0
                    LegendVisible: 0
                             Span: 0
                         TitleTop: 'Elevation Cut (Azimuth Angle = 0^{\circ})'
                      TitleBottom: ''
                            Peaks: []
                         FontSize: 7
                     MagnitudeLim: [-40 10]
               MagnitudeAxisAngle: 75
                    MagnitudeTick: [-40 -30 -20 -10 0 10]
          MagnitudeTickLabelColor: [0.1294 0.1294 0.1294]
                         AngleLim: [0 360]
                   AngleTickLabel: {'0'  '15'  '30'  '45'  '60'  '75'  '90'  '105'  '120'  '135'  '150'  '165'  '180'  '195'  '210'  '225'  '240'  '255'  '270'  '285'  '300'  '315'  '330'  '345'}
              AngleTickLabelColor: [0.1294 0.1294 0.1294]
       TitleTopFontSizeMultiplier: 1.1000
    TitleBottomFontSizeMultiplier: 0.9000
               TitleTopFontWeight: 'bold'
            TitleBottomFontWeight: 'normal'
          TitleTopTextInterpreter: 'tex'
       TitleBottomTextInterpreter: 'none'
                   TitleTopOffset: 0.1500
                TitleBottomOffset: 0.1500
                         ToolTips: 1
               MagnitudeLimBounds: [-Inf Inf]
      MagnitudeFontSizeMultiplier: 0.9000
          AngleFontSizeMultiplier: 1
                       AngleAtTop: 90
                   AngleDirection: 'ccw'
                  AngleResolution: 15
           AngleTickLabelRotation: 0
             AngleTickLabelFormat: '360'
          AngleTickLabelColorMode: 'contrast'
                     PeaksOptions: {}
            AngleTickLabelVisible: 1
                            Style: 'line'
                        DataUnits: 'dB'
                     DisplayUnits: 'dB'
                    NormalizeData: 0
                 ConnectEndpoints: 0
              DisconnectAngleGaps: 0
                        EdgeColor: 'k'
                        LineStyle: '-'
                        LineWidth: 1
                         FontName: 'Helvetica'
                     FontSizeMode: 'auto'
              GridForegroundColor: [0.3804 0.3804 0.3804]
              GridBackgroundColor: [1 1 1]
                 DrawGridToOrigin: 0
                     GridOverData: 0
               GridAutoRefinement: 0
                        GridWidth: 0.5000
                      GridVisible: 1
                         ClipData: 1
                  TemporaryCursor: 1
                 MagnitudeLimMode: 'auto'
           MagnitudeAxisAngleMode: 'auto'
                MagnitudeTickMode: 'auto'
      MagnitudeTickLabelColorMode: 'contrast'
        MagnitudeTickLabelVisible: 1
                   MagnitudeUnits: ''
                   IntensityUnits: ''
                           Marker: 'none'
                       MarkerSize: 6
                           Parent: [1×1 Figure]
                         NextPlot: 'replace'
                       ColorOrder: [7×3 double]
                  ColorOrderIndex: 1
                     SectorsColor: [16×3 double]
                     SectorsAlpha: 0.5000
                             View: 'full'
                    ZeroAngleLine: 0

  Methods, Events, Superclasses
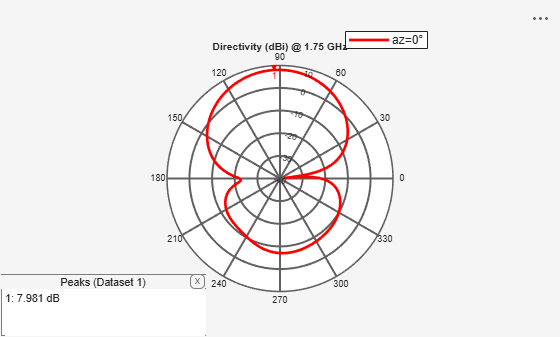
Create a microstrip patch antenna.
fc = 1.75e9;
ant = patchMicrostrip;
Plot the vertical pattern slice and create a polarpattern object from the current figure.
pattern(ant,fc,0,0:1:360);
p = polarpattern("gco");
Customize the appearance using polarpattern properties.
p.LineWidth = 2;
p.Color = "r";
p.LegendLabels = ['az=0' char(176)];
p.LegendVisible = 1;
p.TitleTop = "Directivity (dBi) @ 1.75 GHz";
p.Peaks = 1;
Version History
Introduced in R2016a
See Also
Properties
- PolarPattern Properties (Antenna Toolbox)
Functions
pattern(Antenna Toolbox) |patternCustom(Antenna Toolbox)